Last-click attribution gives all the credit to the final recorded source before the conversion, and Meta and Pinterest are almost never that source. They start journeys. Brand search, email and direct visits finish them. So the channel that created the demand gets nothing and the channel that collected it gets everything.
That is not a tracking bug. It is what the model is designed to do — and it is the reason so many accounts cut paid social, watch brand search “improve”, and then watch total sales fall a month later.
What does last-click attribution actually measure?
It measures the last recorded source before the order, and nothing else. Not influence, not demand creation, not who introduced the buyer. If the converting session carries no source, most implementations step back to the last known non-direct touch; if that is missing too, the sale lands in Direct.
The model is popular because it is cheap and unambiguous: one conversion, one owner, no arguing about fractions. It is fine for the question it answers — which channel closed it? — and useless for the question most budget decisions actually ask: which channel caused it? Mixing the two up is the most common way to misread an attribution report.
Why do Meta and Pinterest lose credit under last click?
Because both are discovery surfaces, and a discovery touch is structurally almost never the last one. Four independent mechanics push them out of final position, and they stack.
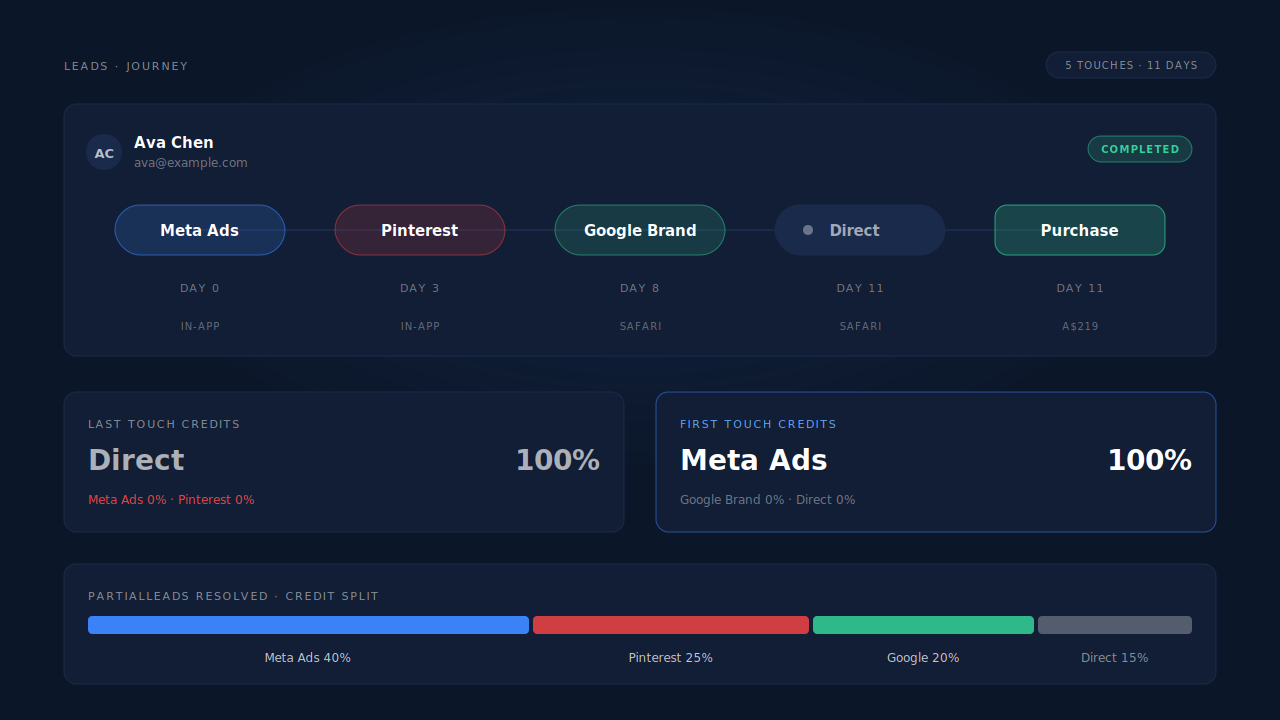
The click happens in an in-app browser; the purchase does not. A tap on a Meta or Pinterest ad opens an in-app webview inside the app, with its own storage. The buyer looks, leaves, and comes back hours or days later in Safari or Chrome — a completely fresh browser with no referrer and no memory of the ad. That second session is the one that converts, and it looks anonymous, which is a large part of why ad conversions show up as Direct.
The lag is longer than the window. Pinterest is a planning surface — people save now and buy later. Meta sits between discovery and consideration. Either way the gap between the first tap and the order is routinely measured in days or weeks, and every attribution window is a decision about how much of that gap you are willing to look back through. Set the window shorter than your real purchase lag and you are not measuring the channel, you are measuring your window.
Brand search harvests what social created. Someone sees the ad, remembers the name, searches it, clicks the brand ad or the organic result, and buys. Last click gives that sale to Google. The brand campaign posts a spectacular cost per acquisition because it is charging for demand it did not create — and the moment you cut the channel upstream, that campaign’s volume dries up with no obvious culprit.
View-through demand is invisible to any click model. Meta reports actions against both click and view attribution windows — its Marketing API exposes attribution windows including a one-day view window alongside click windows (Meta, Marketing API Insights). A last-click model only knows about clicks, so the part of your paid social spend that works by impression is not undercounted, it is structurally unmeasurable.
What does the undercount actually cost you?
Two things, and the second is worse than the first. The obvious cost is a misallocated budget. The quiet one is that you degrade the channel you cut, because ad platforms optimise on the conversions they receive.
Budget first. If Meta and Pinterest are credited with a fraction of the revenue they influenced, their cost per acquisition is inflated by the same fraction. You cut them. Brand search and email keep converting for a few weeks on demand already in the pipeline, so the dashboard briefly looks better. Then the pipeline empties. By the time the drop shows up, it is a month away from the decision that caused it and gets blamed on seasonality.
The second cost is mechanical. A platform’s bidding model learns from the conversions you report back to it. Starve Meta of purchase events and its algorithm has fewer examples of who converts, so targeting and delivery get worse — which produces exactly the poor results the original measurement predicted. That loop is why “we tested Meta and it didn’t work” and “our Meta tracking was broken” are so often the same sentence.
There is a reporting cost too. Every platform claims conversions under its own model and its own windows, so their numbers overlap. Summing platform-reported revenue always exceeds what the bank shows, which is the same root cause as Google Ads and Meta both claiming the same conversion.
How do you check whether your paid social is undervalued?
Compare models on the same conversions over the same dates before you touch a budget. Six checks, in the order that costs least.
- Put first touch next to last touch. Same purchases, same period. If a channel’s first-touch revenue is several times its last-touch revenue, it is a demand creator being paid like a closer.
- Read the assist view. Channels that appear repeatedly in multi-touch paths without closing are doing work that single-touch models delete by definition. That is what assisted revenue in attribution reports is for, including the reason it can exceed total revenue.
- Measure your actual lag before setting a window. Pull the distribution of days between first touch and purchase. If a meaningful share sits past your lookback window, your window is the finding.
- Align windows before comparing platforms. Meta, Pinterest and Google each report on their own click and view settings. Comparing two platforms on two different windows is not a comparison.
- Check the size of your Direct bucket. If Direct is one of your largest “channels”, you do not have a Direct problem — you have a source-resolution problem, and paid social is the channel most likely to be hiding inside it.
- Run a holdout. Turn a channel off in a matched set of geos, leave it on elsewhere, and measure the difference in total orders. It is the only method on this list that answers causation rather than bookkeeping.
The honest limit: none of the first five prove a channel caused anything. Attribution models redistribute credit for touches that were recorded. They cannot tell you what would have happened otherwise, and they cannot invent a touch that was never captured in the first place. That second constraint is the one that quietly breaks most model comparisons — if the Meta click was lost when the buyer switched from an in-app browser to Safari, no model recovers it, because there is nothing to redistribute.
Which attribution model should you use instead?
None of them alone. Use last touch to judge harvesting channels, first touch to judge discovery channels, the assist and path view for the middle, and a holdout test when the decision is big enough to deserve a real answer.
The useful output of an attribution report is not a winner. It is the disagreement between models: a channel that ranks fifth on last touch and first on first touch is telling you something specific, and one that ranks the same in every model is genuinely self-contained. A report that returns a single number hides that.
Which is why the harder half of this problem is not the model at all. It is whether the touches feeding every model are complete.
How does PartialLeads show what last click hides?
By recording both attribution models on every matched purchase, and by reconstructing the touches that go missing between an in-app tap and a desktop checkout. Every purchase matched to a session writes both a first-touch and a last-touch attribution row, snapshotting the UTMs, click IDs, referrer, landing page and time-to-purchase for each — so model comparison is a read, not a re-processing job.
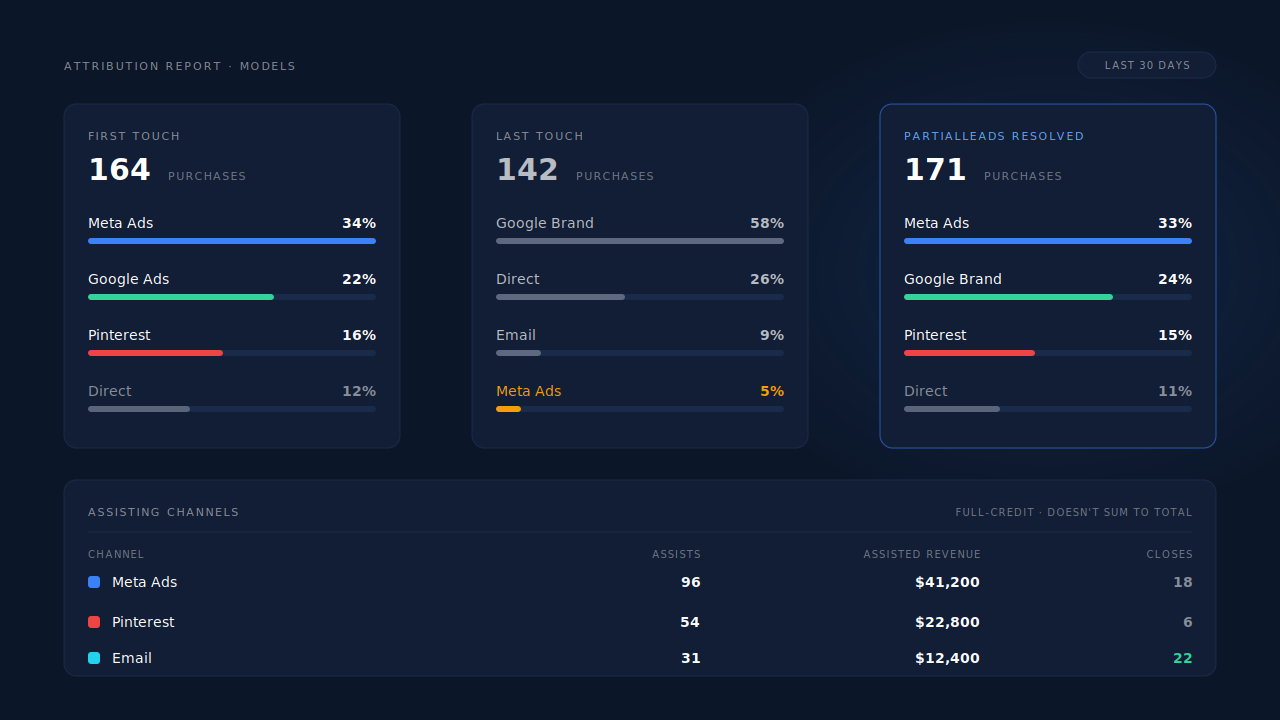
The Attribution report shows three models side by side: First Touch, Last Touch, and PartialLeads Resolved, each with its own purchase count and per-channel percentage split. The resolved model can show a higher purchase count than the other two, because it recovers purchases they lose entirely.
That recovery is itemised rather than asserted. The Recovered Attribution panel breaks it into three named mechanisms: iOS ad-click rescue (a first touch re-linked to a lost ad click), reclassified by session intelligence (no utm_source, but the session classifier resolved a real channel — typically the largest bucket, and the one that would otherwise read as Direct), and partial-lead revenue (matched buyers whose session never finished a form).
Underneath it is the identity layer. A six-tier cluster unions a person’s sessions by visitor ID, email, phone, IP and user-agent, device fingerprint and click ID, and visit-sibling inheritance heals attribution inside a single visit — so the in-app tap and the Safari purchase resolve to one person rather than two anonymous visitors. That mechanic is covered in full in how visitor identity resolution works, and it is the same machinery behind tracking a mobile ad click to a desktop purchase.
The rest of the report is built for exactly the checks listed above. The Channels table carries a First / Last / Resolved toggle with Revenue, Purchases, AOV, Avg Lag, Visitors, V→L and ROAS per channel, and paid channels expand to their campaigns. Conversion Paths & Assists shows full path sequences with counts, a touches-per-purchase distribution, a days-to-purchase distribution, and an Assisting Channels table labelled full-credit · doesn’t sum to total. Time to Purchase plots the first-touch series against the last-touch series, so journey length and decision length are separable.
Three honest constraints. The default display model is Last-Non-Direct with a 28-day decay window, chosen deliberately to match Meta’s 28-day standard so the reports agree with Ads Manager instead of fighting it — the other models are a toggle away, not the default. The resolved model is deterministic matching of touches that were actually recorded; it recovers signal, it does not model incrementality, so a holdout test is still the only causal answer. And a view-through impression never reaches your site at all, so nothing server-side can recover it — that gap is real for every vendor, including this one.
| What breaks | The mechanism | Where you see it in the dashboard |
|---|---|---|
| Social tap happens in an in-app browser, purchase happens in Safari | Six-tier identity cluster unions sessions by visitor ID, email, phone, IP + UA, fingerprint and click ID | Journey ribbon on the Leads list |
| Converting session carries no source, so the sale reads as Direct | Visit-sibling inheritance plus the session classifier resolve the real channel | Recovered Attribution — “reclassified by session intelligence” |
| Last click hands a social-created sale to brand search | First-touch and last-touch rows written on every matched purchase | Attribution Models — First / Last / Resolved, side by side |
| Assisting channels get no credit at all | Full-credit assist crediting per channel, with path sequences and counts | Conversion Paths & Assists — Assisting Channels table |
| Purchase lag is longer than your lookback window | Time-to-purchase snapshotted on every attribution row | Time to Purchase — first-touch vs last-touch series |
| Buyer typed an email but never submitted, so no lead exists to match | Partial lead capture matched to the purchase on email or phone | Recovered Attribution — “partial-lead revenue” |
Tell us what's broken. We'll fix your tracking — free.
Describe the tracking/attribution problem you're stuck on and we'll map it to a fix: server-side conversions to Meta, Google, TikTok and Pinterest, plus first-party tracking that survives Safari. No code required.
Sources
- Meta — Marketing API Insights (action attribution windows, click and view): https://developers.facebook.com/docs/marketing-api/insights
- Meta — Conversions API overview: https://developers.facebook.com/docs/marketing-api/conversions-api
- Meta — Conversions API server event parameters (event_time): https://developers.facebook.com/docs/marketing-api/conversions-api/parameters/server-event