Assisted revenue is the total value of the orders a channel touched on the way to a sale without being the last touch before it. Every assisting channel is credited the full order value, not a slice of it. So one order that touched three channels appears at full value in three separate rows, and the column routinely exceeds your total revenue without anything being broken.
That is a units problem, not a maths error. Your conversion table measures ownership. Your assist table measures involvement. Adding one to the other produces a number that corresponds to nothing.
What is assisted revenue?
The revenue of every order a channel participated in but did not close. “Did not close” is the load-bearing part: the last touch before the purchase owns the sale in the conversion table, and every other touch in that path is an assist. Assisted revenue sums those order values per assisting channel, at full value each.
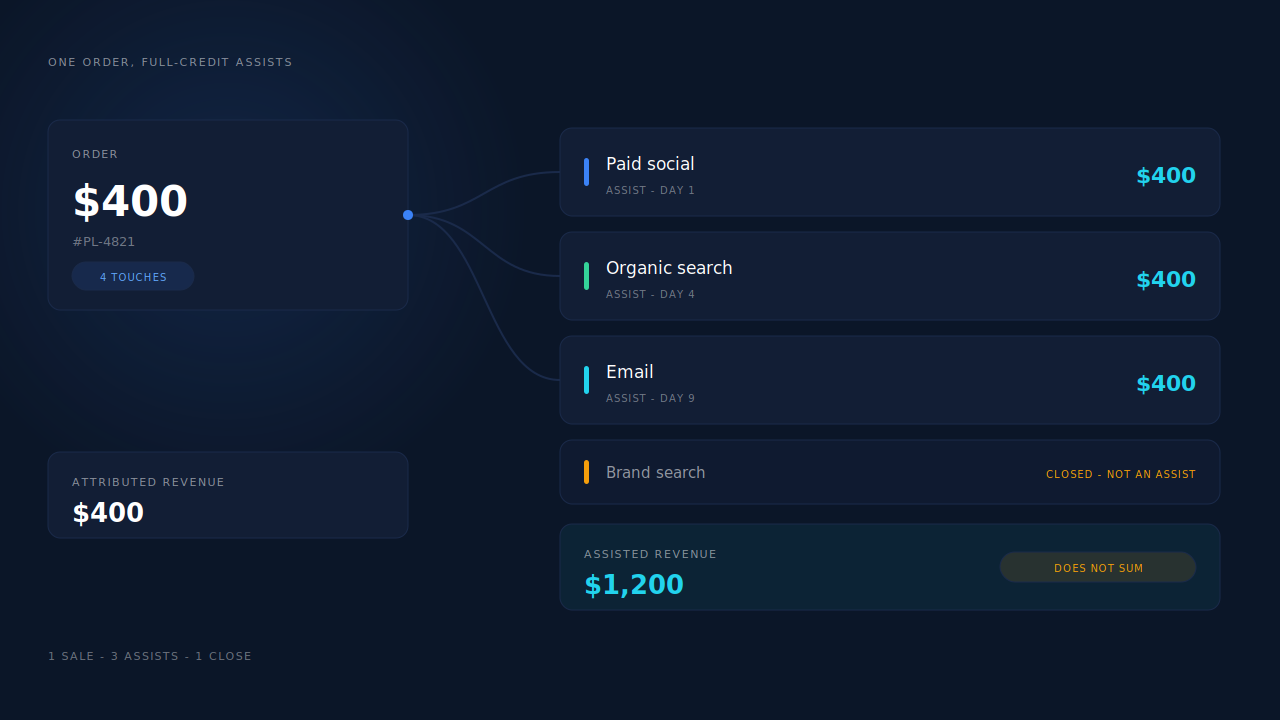
A worked example with round numbers. One order, $400:
- Day 1 — a paid social ad introduces someone who was not looking for you. She does not convert.
- Day 4 — she finds a comparison post through organic search and reads it.
- Day 9 — an email brings her back to the site.
- Day 9, an hour later — she searches your brand name and buys.
Branded search was the last touch, so it owns the $400 in the conversion table. Paid social, organic search and email each record $400 of assisted revenue. One sale of $400 produces $1,200 of assisted revenue across three rows.
That is the metric working as designed. The assist column is not a competing estimate of your revenue — it answers a different question: which channels keep turning up in the paths that end in a sale?
Why can assisted revenue exceed your total revenue?
Because each assisting channel is credited the whole order value instead of a fraction of it. The alternative — splitting one order’s value across its touches — produces a column that does add up, at the cost of inventing a weighting nobody can verify. Full credit refuses to invent the split and gives you a countable fact instead: this channel was in the path.
There is a rough ceiling worth knowing, and it is just arithmetic. If your journeys average four touches, three of them are assists, so assisted revenue lands near three times attributed revenue. Invert it and the ratio becomes a diagnostic: divide total assisted revenue by total attributed revenue, add one, and you have an estimate of your average touches per purchase.
Check that estimate against the touches-per-purchase distribution in the same report. If the ratio implies four touches but the distribution says most purchases are single-touch, a few very long journeys are dragging the average while the rest are not being stitched together at all.
Two practical consequences. Never put assisted revenue in a total row. And never let it into a ROAS calculation: dividing full-credit assisted revenue by spend inflates the return by however many channels were in the path — a property of your channel mix, not your advertising.
What is the difference between an assist and a conversion?
A conversion is exclusive and an assist is inclusive. Exactly one touch owns each sale under whichever model the report is running, so the conversion column sums to your revenue. Any number of touches can assist the same sale, so the assist column sums to nothing in particular. One is a partition; the other is a membership test.
The practical difference shows up when a channel’s two numbers disagree. A small conversion number beside a large assist number is not underperformance — it is performing early, in a position the conversion table structurally cannot reward.
One thing to check before you compare anything: how your tool defines an assist. The definitions differ. Some count every non-last touch, some exclude the first touch because the first-touch model already credits it, some count only paid channels. Whether the first touch counts changes every row in the table, and it is almost never stated on the report itself.
How do you use assisted revenue to make a decision?
As a ratio, never as a total. Compare each channel’s share of all assists against its share of all closes, and the four combinations tell you what each channel is for. That comparison is the entire practical value of the metric.
High assists, low closes — the introducer. In the path constantly, almost never last. Cold paid social, display, YouTube, most content. This is where budgets get cut by accident: a last-click report shows almost no revenue while the channel quietly starts a large share of the journeys that end in some.
Low assists, high closes — the harvester. Branded search, retargeting, email to a list you already own. It converts demand something else created. Efficient on paper, and the efficiency is partly borrowed. A harvester growing while your introducers shrink is a leading indicator, not a win.
High on both — load-bearing. It starts journeys and finishes them. Scale it first.
Low on both — the honest cut candidate. Rarely in the path, rarely closing. The only quadrant where “small attributed revenue” means what it appears to mean.
The caveat that keeps this honest: assists are correlational. Presence in a path is not evidence of causing anything, and a high assist count can just mean high reach. The only way to find out whether an introducer is load-bearing is to turn it down and watch your closers a few weeks later. Assisted revenue tells you which channels are worth running that test on — useful, and less than a causal claim. Deciding which channel to scale is still a question about what happens when you move budget, and no column answers it for you.
Why does your assist report show almost no assists?
Almost always because the tool is not connecting sessions into people, not because your customers buy on one touch. Multi-touch reporting requires knowing that the visitor who clicked the ad in March is the person who bought in April. If the identity layer underneath cannot make that join, every journey the report sees is one session long, and a one-session journey has no assists by definition.
This failure is quiet. There is no error message for a report that stopped stitching people together; the assist table just gets thinner, and reads as a fact about your customers rather than your measurement.
Three structural causes, all of them invisible in the report itself:
- Cookie expiry. Safari’s tracking protection caps the lifetime of script-written cookies at a few days, so a returning visitor arrives as a stranger and her earlier touches are gone from the path.
- Device switching. The ad click happens on a phone and the purchase happens on a laptop. Without an identifier shared between them, tracking a lead across devices fails silently and one journey is filed as two.
- Unsourced sessions. A path that reads
Organic > Directis not a path through a channel called Direct. Direct is the label a report applies when it could not work out where a session came from, and it turns up in paths for the same reasons ad conversions show up as Direct in the conversion table.
So the reading order is the opposite of intuitive. Before you interpret a single assist row, look at the touches-per-purchase distribution. If it says most purchases are single-touch, that is a finding about how your tool resolves visitor identity, and the assist table above it is not yet worth reading.
There is also a floor no configuration moves. A report can only join journeys for people who identified themselves somewhere in one. A visitor who typed an email into your form and left without submitting is an identifiable person — a partial lead — but only if something captured that field before the tab closed. If nothing did, there is no key to join on, and every touch she made stays orphaned.
Why doesn’t your ad platform show you assisted revenue?
Because each platform can only see its own touches. Meta knows which of your buyers saw a Meta ad; it has no way to know that organic search and an email were also in the path. An assist is a statement about a journey across channels, so it can only exist in a report that sees every channel — which means your own.
This is also why platform-reported conversions add up to more than your order count — a different double-count from assists. Each platform credits the sale under its own window and its own rule, so two can both legitimately claim the same order. That overlap is every platform grading its own homework; assisted revenue is one report deliberately crediting a channel it knows did not close. Do not reconcile the two into one number.
Deduplication is the third thing in this neighbourhood that inflates a total, and the only one that is an actual defect. The same conversion can reach a platform twice, once from the browser and once from your server. Meta deduplicates the pair when both copies carry the same event name and the same event ID; when they do not, one sale is counted as two, and unevenly across channels. If you send conversions server-side through the Conversions API, that shared event ID is the thing to verify before you trust any platform total.
How does PartialLeads report assisted revenue?
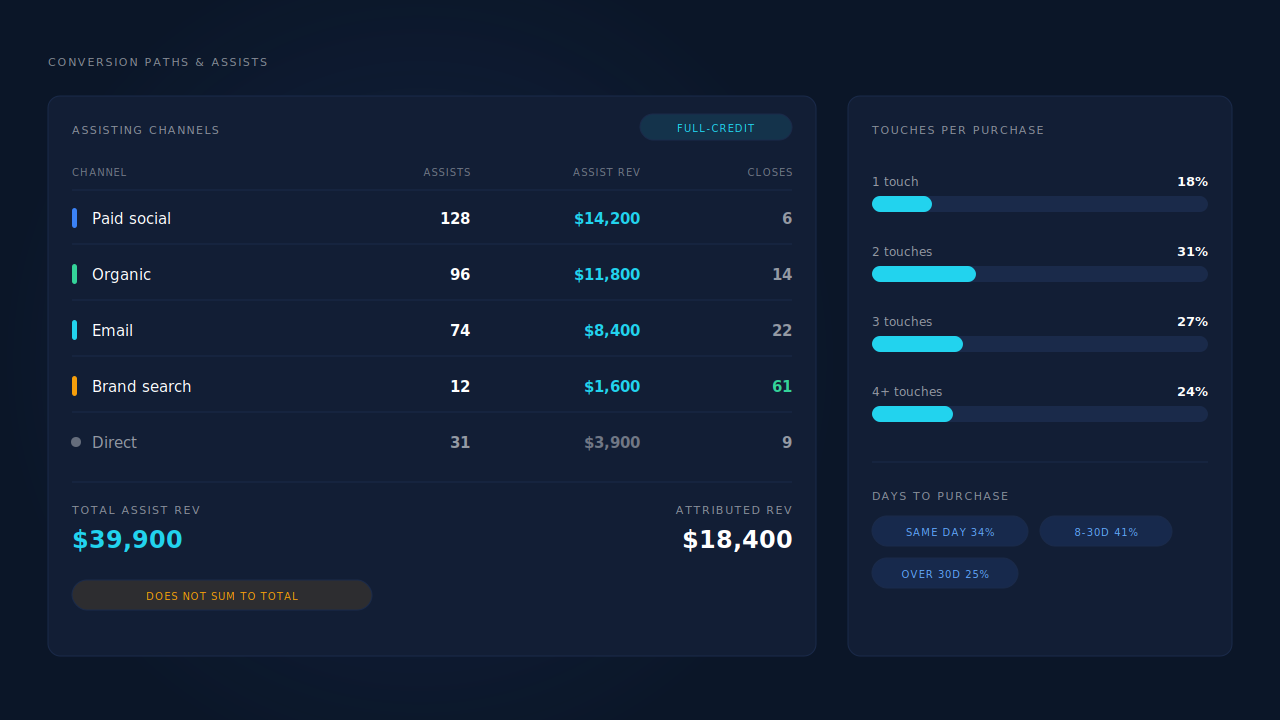
In a panel that states its own arithmetic. Conversion Paths & Assists in the Attribution report answers “how buyers reach the sale, and which channels assist without closing”, and its Assisting Channels table carries three columns — assists, assisted revenue, and closes — under a label that says explicitly full-credit, does not sum to total. The ratio this article is built on is a column comparison, not a calculation you do yourself.
Beside it sit the two distributions that tell you whether the assist table is trustworthy: full path sequences with counts, single-touch and multi-touch alike, and a touches-per-purchase distribution across one, two, three and four-plus touches. A days-to-purchase distribution runs underneath. If the touches distribution collapses onto “1”, that is visible on the same screen as the assist table it invalidates — which is the point.
The reason the paths hold up is the layer below them. Every visitor’s sessions are unioned into one person across six tiers — visitor ID, email, phone, IP with user agent, device fingerprint, and click ID — and a conversion session arriving with no campaign parameters can inherit attribution from a sibling session in the same visit. The visitor ID is a first-party cookie set by the server rather than by script, so Safari’s cap on script-written cookies does not truncate it. Each matched purchase writes both a first-touch and a last-touch row, so the assist view and the ownership view come from one stored journey rather than two passes over the data.
Above the panel, three attribution models render side by side — First Touch, Last Touch and PartialLeads Resolved — each with its own purchase count and per-channel split, so a channel’s rank moves between rules in front of you. The resolved model can carry a higher purchase count than the other two, because it recovers purchases a raw first- or last-click view drops for having no identifiable source. The Channels table carries the same First / Last / Resolved toggle, with average lag, visitor-to-lead rate and ROAS columns. Per-person proof lives on the Leads list itself: the Journey ribbon renders each touch as a badge in order, with a grey dot where the source is genuinely unknown rather than a channel named Direct.
| What breaks | The mechanism | Where you see it in the dashboard |
|---|---|---|
| Assisted revenue added to attributed revenue | Assisting Channels table labelled full-credit, does not sum to total | Conversion Paths & Assists |
| A channel that introduces buyers but never closes | Assists, assisted revenue and closes as separate columns | Assisting Channels table |
| Journeys that look single-touch because sessions were never joined | Six-tier identity cluster unioning a person’s sessions | Touches-per-purchase distribution, Journey ribbon |
| Safari dropping a returning visitor’s earlier touches | Server-set first-party visitor cookie, not script-written | Returning visitors staying on one journey |
| A conversion session arriving with no campaign parameters | Visit-sibling attribution inheritance within the visit | Recovered Attribution, reclassified bucket |
| Paths that read as Direct in the middle | Session classifier resolving a real channel, itemised per channel | Recovered Attribution, per-channel counts |
| One rule presented as the answer | First, Last and Resolved models rendered side by side | Attribution report, model cards |
| Buyers whose form was never submitted | Partial capture before submit, matched to the purchase | Revenue by Match Quality, partial-captured wedge |
| Refunds inflating the revenue an assist is credited with | Refund status-phase rows netted against paid | Purchases ledger, net revenue |
The honest constraints, since the argument here is that a report should state its own limits. The assisting-channels table does not sum to the total, deliberately and permanently — a column that added up would be a fabricated split. The resolved model is built from deterministic joins and bounded inheritance rather than probabilistic modelling, so it will not invent a source where no identifier existed. Conversion metrics can show a “warming up” state while visitor figures are still computing, rather than a confident wrong number. And assists stay correlational no matter how clean the identity layer gets: PartialLeads can prove a channel was in the path, not that it caused the sale. The full reading method that sits over all of this is how to read an attribution report.
Tell us what's broken. We'll fix your tracking — free.
Describe the tracking/attribution problem you're stuck on and we'll map it to a fix: server-side conversions to Meta, Google, TikTok and Pinterest, plus first-party tracking that survives Safari. No code required.
Sources
- Meta for Developers — Conversions API overview: https://developers.facebook.com/docs/marketing-api/conversions-api
- Meta for Developers — Deduplicate Pixel and Conversions API events: https://developers.facebook.com/docs/marketing-api/conversions-api/deduplicate-pixel-and-server-events
- Meta for Developers — Conversions API best practices: https://developers.facebook.com/docs/marketing-api/conversions-api/best-practices