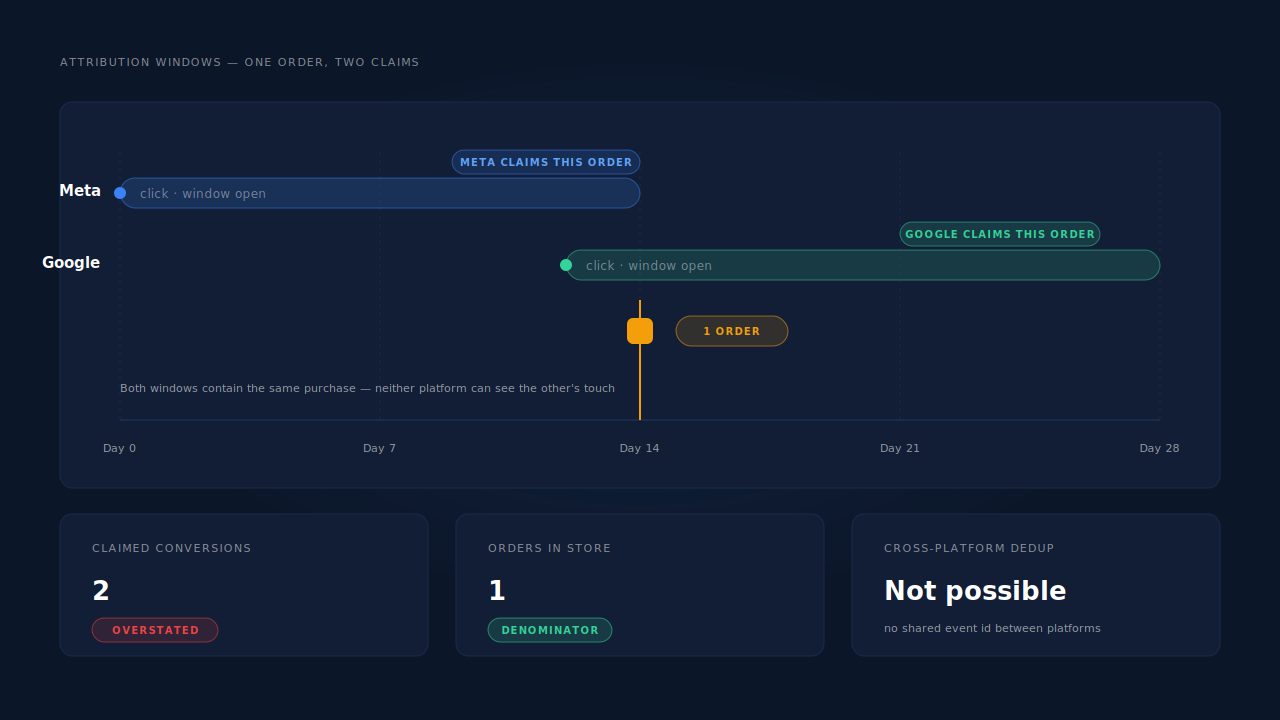
Because each platform only sees its own touch and credits itself in full. Google Ads counts a conversion when its click falls inside its conversion window. Meta counts the same sale when its click or view falls inside its attribution setting. Neither platform can see the other, so both report one whole conversion for one order.
That is not double-counting in the fraud sense. It is two separate measurement systems answering the same question about the same buyer, each with only its own half of the evidence.
The practical problem is what you do next. If you add the two numbers together and divide your spend by the total, every campaign looks more efficient than it is. If you believe only one platform, you will cut the other one and watch your blended results get worse.
What is actually happening when two platforms claim one sale?
One buyer produced one order, and two ad systems each recorded a touch that qualified under their own rules. A shopper taps a Meta ad on Tuesday, does nothing, searches your brand on Thursday, clicks the Google ad, and buys. Google sees a click then a purchase. Meta sees a click then a purchase. Both are telling the truth about what they saw.
Walled-garden reporting is self-attributed by design. Each platform receives your conversion event, checks it against its own record of clicks, views and engagements, and credits itself if it finds a match inside its window. There is no arbitration layer between them and no shared identifier they both agree on.
So the arithmetic breaks in a specific, predictable way: platform-claimed conversions are not mutually exclusive, and they were never meant to be summed. Your store’s order count is the only figure with a denominator.
A worked example, with illustrative numbers: your store did 58 orders last month. Ads Manager claims 35. Google Ads claims 40. That is 75 claimed conversions against 58 real ones — 17 more claims than orders. Those 17 are not phantom sales. They are orders where both platforms had a legitimate touch.
Why doesn’t the double-claiming show up inside either platform?
Because each report is internally consistent. Meta deduplicates Meta events against each other; Google deduplicates Google’s. Neither performs cross-platform deduplication, and neither is capable of it.
This is worth separating from a real duplicate, which is a different failure with a different fix. A real duplicate is one platform counting one event twice — usually a browser pixel and a server event arriving without a shared identifier. Meta’s Conversions API solves that with a matching event_id on both copies so the platform can collapse them (Meta, Conversions API documentation). If your Meta number is inflated against itself, that is a deduplication problem you can debug, and fixing it is worth doing.
Cross-platform overlap survives every one of those fixes. Perfect deduplication inside Meta and perfect deduplication inside Google still leave you with two platforms claiming the same order, because the duplication is not inside either system. It is between them.
The same distinction explains why the gap between one platform and your CRM has causes of its own — different clocks, different populations, different rules — which is a separate reconciliation from the one this article is about.
How do conversion windows and view-through credit widen the overlap?
Longer windows and view-through credit both increase the number of journeys in which two platforms each hold a qualifying touch. A window is the period after a click (or a view) during which a platform will still claim a resulting conversion. The wider that period, the more orders fall inside two platforms’ windows at once.
Three settings do most of the damage:
- Click window length. A brand-search click two days before the order and a paid-social click twelve days before the order can both sit inside their respective windows. Longer windows are not wrong — they are usually more accurate about influence — but they guarantee more overlap.
- View-through credit. Meta’s attribution setting can include impressions that were never clicked. An impression-based claim overlaps a click-based claim on the other platform almost by definition, because the buyer did something else to actually arrive.
- Engaged-view and cross-network credit. Video and multi-surface campaigns can register credit for a view that preceded a click elsewhere. Check the current definitions in each platform’s own documentation before you assume what a given column counts — these settings are changed by the platforms, not by you.
The direction of the effect is what matters for your decisions: every widening of a window increases claimed conversions without changing the number of orders. When someone extends a lookback and reports that performance improved, they have usually measured the setting, not the campaign.
How do you measure the size of the overlap without a third-party tool?
Compare claimed conversions against your own order count over the same period, using your store or CRM as the denominator. You do not need new software to size this — just arithmetic done honestly.
- Pick a clean window. A calendar month, closed, with no mid-month tracking changes.
- Take your real order count from your store admin, payment processor or CRM. That is the denominator and the only number with an unambiguous meaning.
- Take each platform’s claimed conversions for the same period, and write down the attribution setting each one used. Without the setting, the number is uninterpretable.
- Subtract. Claimed total minus real orders is your minimum overlap. Minimum, because some orders had no ad touch at all and some had two touches on the same platform.
- Watch the ratio over time, not the single figure. A claimed-to-actual ratio drifting from 1.2 to 1.6 usually means a window got wider or a new campaign type started claiming views.
Two cautions. Report the platform figures on the same clock — claimed conversions are credited to the date of the click, not the date of the order, so a month boundary will always disagree slightly. And never reconcile during a period when you changed a pixel, a window or a campaign type, because you will not be able to tell which change moved the number.
Which platform should actually get the credit?
Usually the wrong question. “Which platform deserves this sale” assumes a single-touch answer exists, and for a multi-touch journey it does not. The better question is what each touch did, and whether the journey happens at all without it.
Single-touch models are still useful as long as you know what each one hides:
| Model | What it credits | What it systematically undervalues |
|---|---|---|
| Last touch | The final click before the order | Discovery — the paid social or video that created the demand |
| First touch | The click that started the journey | Closing — the brand search or retargeting click that finished it |
| Platform-claimed | Itself, under its own window | Every touch that happened on a platform it cannot see |
Last-click reporting is the reason paid social gets cut: the buyer discovered you on Meta and completed on a branded Google search, so Google gets the row and Meta gets nothing. Read both models side by side and the disagreement between them becomes the signal — that is the point of reading an attribution report without fooling yourself, and it is how you decide which channel is actually worth scaling.
A journey with a missing first touch does the same damage in reverse. When the opening click is lost to cookie loss or a stripped parameter, the whole journey collapses into the last visit and the sale reads as Direct — which quietly transfers credit to whichever platform happened to be last.
What should you change in your reporting instead of your budget?
Change the denominator, not the spend. Stop summing platform-claimed conversions and start comparing them against one deterministic ledger of orders that you own.
Three habits do most of the work:
- Report platform numbers as claims, not counts. Label the column “Meta-claimed” and “Google-claimed” in your own dashboard. It takes one rename and it stops the addition error at the source.
- Keep the platforms fed anyway. Under-reporting to a platform makes its optimisation worse, and an algorithm starved of conversion signal will spend your money badly. Sending a complete server-side event stream through the Conversions API is about giving the algorithm training data, not about producing your reporting number. Those are two different jobs and they should not share a number.
- Decide on blended efficiency, judge on incrementality. Total spend against total revenue is honest, if crude. For a real answer on a single channel’s contribution, the only instrument is a holdout or geo test — a measurement question no attribution tool of any kind can answer for you.
How does PartialLeads resolve one conversion across both platforms?
By matching every purchase back to one person’s stitched sessions, then showing what each attribution model does with that same journey — so the disagreement between platforms becomes visible instead of additive.
The chain is deterministic. Sessions are unioned into one person through a six-tier identity cluster — visitor ID, email, phone, IP plus user-agent, device fingerprint, and a shared click ID — which is how visitor identity resolution works underneath every report on this list. Inbound orders from Shopify, WooCommerce, Stripe, GoHighLevel or a universal webhook are matched to a session with a tiered confidence: a visitor-ID echo is the strongest, then email, then phone, then IP.
Every matched purchase then writes both a first-touch and a last-touch attribution row, snapshotting the UTMs, click IDs, referrer, landing page and time-to-purchase at each end of the journey. That is why the Attribution report can show FIRST TOUCH, LAST TOUCH and PARTIALLEADS RESOLVED as three columns over the same conversions, with a per-channel percentage split under each. One order, three readings, no summation.
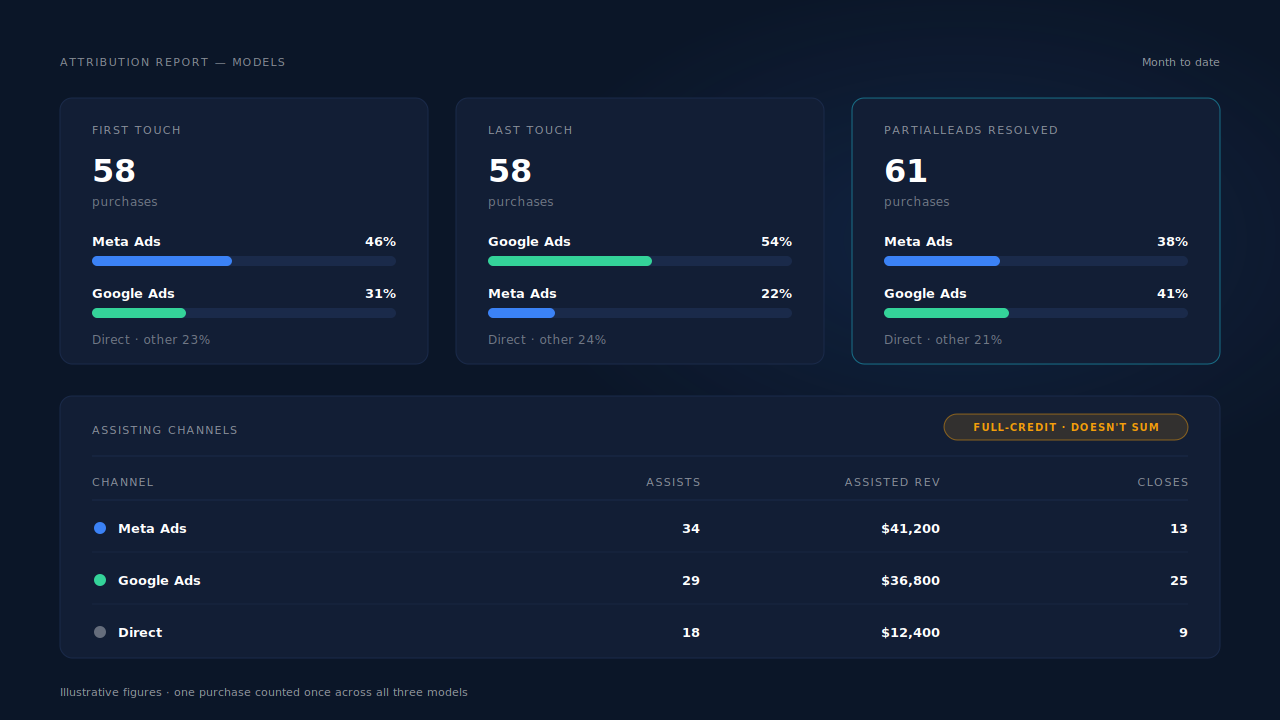
The surface built for exactly this question is Conversion Paths & Assists. It lists the actual path sequences buyers took with counts, a touches-per-purchase distribution, and an Assisting Channels table showing assists, assisted revenue and closes — labelled in-product as full-credit, doesn’t sum to total. That label is the honest version of what the ad platforms do silently: full credit to each assisting channel, openly marked as non-additive.
Two more things make the ledger readable. The Journey column on the Leads list renders each touch as a badge, so a row reads as a sentence — a Meta touch, then a Google touch, then a green conversion square — without opening the record. And the display layer uses last-non-direct crediting with a 28-day decay window, chosen deliberately to match Meta’s standard so the numbers sit next to Ads Manager instead of fighting it.
The honest constraints. PartialLeads cannot stop Google Ads and Meta from each claiming the sale — nobody can, and any vendor who says otherwise is describing their own dashboard, not the platforms’. What changes is that you gain a ledger with a real denominator to read those claims against. The match rate is a KPI on the report for a reason: purchases that cannot be tied to a session land in an unmatched wedge rather than being silently assigned to a channel. And dispatch is the half we control — whether a platform then resolves an event to a user and a click depends on its own graph, opt-outs and consent.
| What breaks | The mechanism | Where you see it in the dashboard |
|---|---|---|
| Two platforms each claim the same order | Purchase matched to one stitched identity cluster, first-touch and last-touch rows written per purchase | Attribution report — FIRST TOUCH / LAST TOUCH / PARTIALLEADS RESOLVED, side by side |
| Summing platform claims inflates conversions | One deterministic order ledger with a match rate and an unmatched wedge | Purchases ledger; Match Rate KPI; Revenue by Match Quality donut |
| Discovery channels look worthless under last click | Full path sequences, assists, assisted revenue and closes, marked non-additive | Conversion Paths & Assists — Assisting Channels table |
| You can’t tell which touches a buyer actually had | Per-touch badges rendered at list resolution | Leads list — Journey column |
| The opening ad click is lost and the sale reads as Direct | Session-intelligence reclassification and ad-click rescue, itemised by mechanism | Attribution report — Recovered Attribution |
Tell us what's broken. We'll fix your tracking — free.
Describe the tracking/attribution problem you're stuck on and we'll map it to a fix: server-side conversions to Meta, Google, TikTok and Pinterest, plus first-party tracking that survives Safari. No code required.
Sources
- https://developers.facebook.com/docs/marketing-api/conversions-api/
- https://developers.facebook.com/docs/marketing-api/conversions-api/deduplicate-pixel-and-server-events/
- https://developers.facebook.com/docs/marketing-api/conversions-api/parameters/server-event/