Convert both sides into one reporting currency at a rate dated to the day each transaction happened, then divide net revenue by total media spend over the same date range in the same timezone. The division is trivial. The four inputs are what break: what counts as revenue, what counts as spend, which rate, and which date that rate carries.
Most cross-border ROAS arguments are not disagreements about performance. They are two people dividing differently sourced numbers and both calling the result ROAS.
What is blended ROAS, and what does it actually measure?
Blended ROAS is all revenue in a period divided by all media spend in that period, with no attribution model in between. It answers one question: for every dollar the business put into ads this month, how many came back in total? It deliberately ignores which campaign produced which sale.
That is its strength and its limit. Because nothing is attributed, nothing can be double-counted, so blended ROAS is immune to the credit fights that make platform-reported numbers disagree. It is also blind: it cannot tell you which campaign to cut, and it silently credits your paid channels with revenue that organic, email and repeat customers produced.
Use blended ROAS as the business-level guardrail and a per-channel, attributed view for allocation decisions. Those are different instruments. Reading an attribution report honestly is what the second one needs; this article is about making the first one stop lying.
A working definition to put at the top of the report: net revenue recognised in the period, in the reporting currency, divided by media spend billed in the period, in the reporting currency. Every ambiguity below is an argument about one of those clauses.
Which two numbers go above and below the line?
The numerator is net revenue in your reporting currency. The denominator is total media spend, including platform fees and any media tax, in the same currency. Both are period totals, not attributed amounts, and both need the same start and end instants.
The denominator is the easier half and still goes wrong three ways. Ad accounts bill in their own currency — an agency running one brand across a US, a European and an Australian account has three billing currencies before a single sale happens. Some platforms report spend excluding the tax you are invoiced for, so the number in the reporting UI and the number on the invoice differ. And the platform’s own reporting converts historical spend to the account currency at its rate, not yours.
The numerator is harder, because revenue arrives in whatever currency the buyer paid in. A Shopify store selling in five presentment currencies produces five streams of order values, each already converted once by the payment processor at the moment of capture.
Decide once whether the numerator is gross order value, net of refunds, or net of refunds and tax and shipping, then write it on the report. Most teams should use net of refunds, excluding tax and shipping, because that is closest to the money the business actually keeps from the ad — and because refunds otherwise inflate attributed revenue every month that a return lands.
Which exchange rate do you use, and what date should it carry?
Use the rate for the date the transaction occurred — the order’s capture date for revenue, the billing date for spend — from one published source you never change mid-year. A converted figure without a rate date is not a figure; it is an opinion that will be different tomorrow.
There are three defensible conventions, and one bad one.
Transaction-date rates. Each order and each day of spend is converted at that day’s rate. Most accurate, and the only version that stays stable once the period closes. This is the default worth arguing for.
Period-average rates. One rate per month applied to everything in that month. Cheaper to compute, acceptable for management reporting, and it smears the effect of any mid-period currency move across both sides evenly.
Booking-rate pass-through. Use the rate your payment processor already applied at capture, which is what actually hit your bank. Most accurate to cash, but the rate embeds a processor spread, so it is not comparable to your ad account’s conversion.
The bad one is converting historical figures at today’s rate. It re-states last quarter every time you open the report, and it means the ROAS number you circulated on Monday no longer exists on Friday.
Pick a source and name it on the report — the European Central Bank’s daily euro reference rates are the common choice for management reporting, and they are what the PartialLeads reports quote from. Then show the as-of date beside every converted total, the same way reporting attribution in multiple currencies requires it. A total that says “≈ A$48,200, ECB rates as of 12 Sep” can be audited. One that says “A$48,200” cannot.
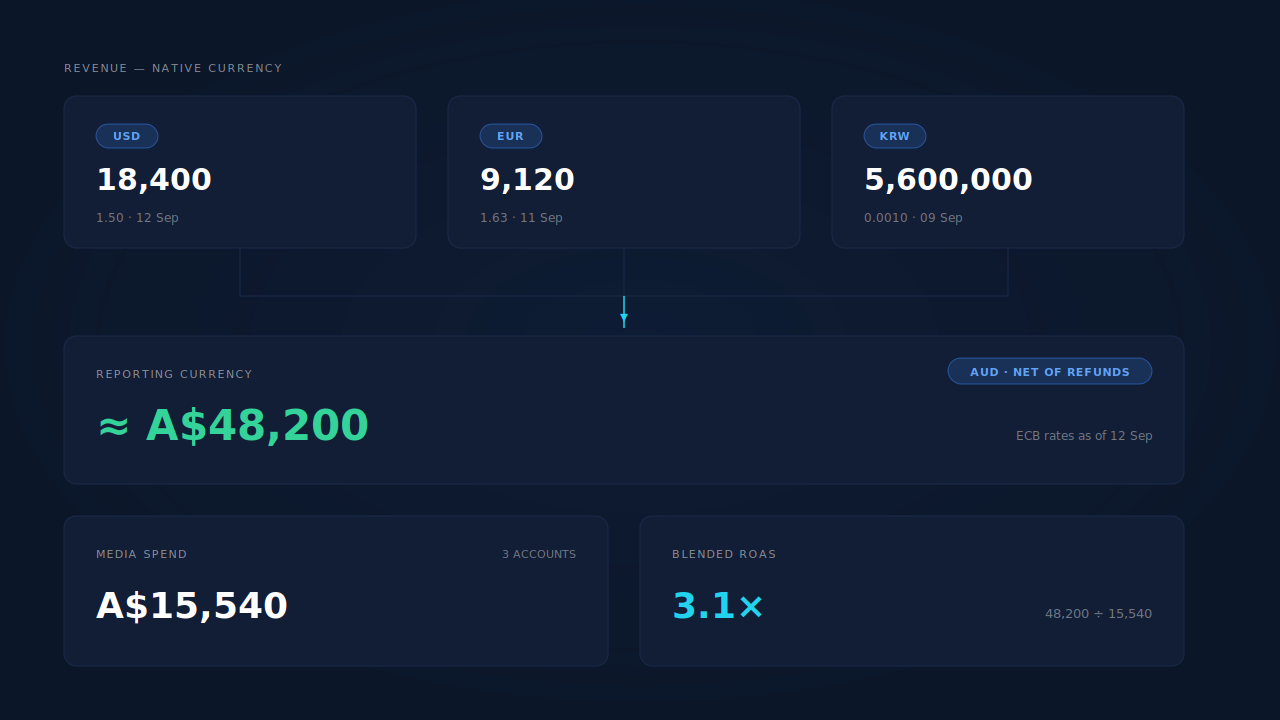
Why does last month’s ROAS change when you recalculate it?
Because something in the calculation floats. Three usual suspects: live rates applied to closed periods, refunds landing after the period closed, and spend figures that the platform restates after invoicing. All three are fixable, and the fix is the same — freeze the inputs and keep the frozen copy.
Once a period closes, snapshot the converted totals and the rate date that produced them, and report from the snapshot. If a refund arrives in October against a September order, you have a policy choice: restate September, or net the refund in October. Either is defensible. Silently doing one this quarter and the other next quarter is how a board deck loses credibility.
Agencies get hit hardest here, because a client’s monthly invoice is built on one version of the number and the dashboard keeps recomputing another. If the report is contractual, the snapshot is the report.
Why does your ad platform still report a different ROAS?
Because you are computing a blended, deterministic, net figure, and the platform is computing an attributed, modelled, gross one — in its own account currency, on its own clock. Converting your side correctly does not make the two comparable. It just removes currency as one of the reasons they differ.
Four differences survive the conversion.
Attribution. Platform ROAS counts revenue the platform believes it caused, including view-through conversions and modelled ones. Blended ROAS counts everything, caused or not. The first is a subset measured generously; the second is a superset measured literally.
Double counting across platforms. Two platforms will both claim the same sale, so their reported revenue sums to more than your bank statement — which is exactly why Google Ads and Meta both claim the same conversion.
Currency handling. The platform converts the conversion value you sent into the ad account’s currency at its own rate and timing. Send a purchase as value: 129.00, currency: "EUR" and the platform stores the value with its ISO 4217 currency code and converts for reporting (Meta, Conversions API custom data parameters). Your report converted the same order with a different rate on a different date. Small gap, but a real one.
The day boundary. An ad account set to America/Los_Angeles and a revenue report set to Australia/Sydney do not share a Tuesday. Daily ROAS will disagree even when the monthly totals match, and it is worth understanding why your dashboard timezone changes your numbers before blaming the conversion rate.
The honest version of this comparison is a table with both numbers, the method under each, and no attempt to reconcile them to the cent.
How does PartialLeads help you calculate blended ROAS across currencies?
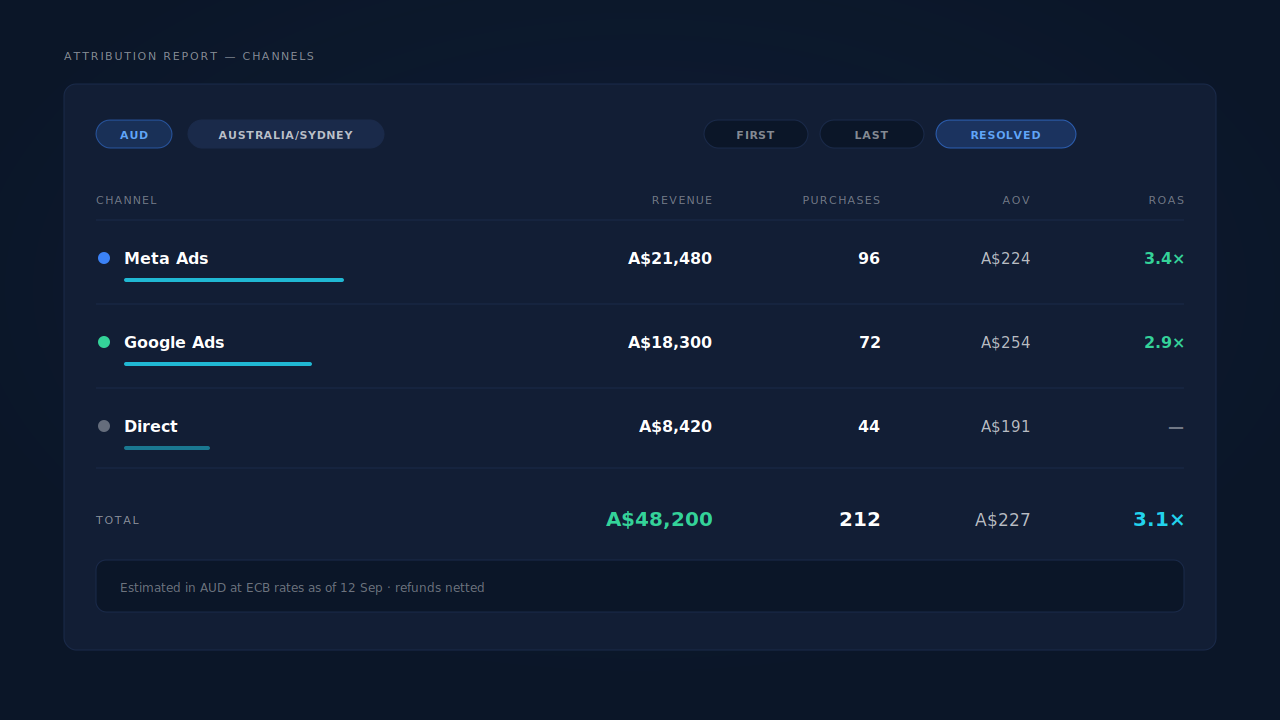
It fixes the numerator — the half that is normally guesswork. Every matched purchase is stored with the value and the currency the buyer actually paid in, refunds are recorded as their own status-phase rows that net against paid revenue, and the Attribution report normalises the mix into one display currency at ECB rates with the as-of date shown in the footnote.
That matters because the common failure is not bad division. It is a numerator assembled from a CRM that only stores one currency, a spreadsheet where someone applied today’s rate to last quarter, and a refund file nobody joined. Attributing ecommerce revenue to the ad click is the upstream half of this; the currency work is what makes the totals addable afterwards.
The report carries a currency selector and a timezone selector, so the same period can be read in AUD on the operator’s clock or in the currency a client is invoiced in — without re-exporting anything. The Channels table shows Revenue, Purchases, AOV and a ROAS column per channel, with paid channels expanding to their campaigns, and the three attribution models sit side by side so you can see how much of the ROAS gap is model choice rather than currency.
Two honest constraints. The cost figure in any ROAS calculation originates in your ad account, so confirm where your spend number comes from and which currency it is billed in before you trust a divided figure. And the per-channel ROAS in the report is attributed, not blended — blended ROAS is arithmetic you do on the period totals, which is the point of getting those totals into one currency in the first place.
| What breaks | The mechanism | Where you see it in the dashboard |
|---|---|---|
| Revenue arrives in five currencies and can’t be summed | Each purchase stored with its own value and currency code, normalised to one display currency at ECB rates | Attribution report, currency selector and the “estimated at ECB rates as of” footnote |
| Refunds inflate the numerator | Refunds recorded as their own status-phase rows that net against paid revenue | Purchases ledger, net revenue |
| The ROAS number changes every time it’s recalculated | Converted totals carry the rate’s as-of date, so a closed period can be snapshotted and re-read | Attribution report footnote |
| Daily figures disagree with the ad account | Operator timezone applied to the period, so days are bucketed on one clock | Timezone selector on the report |
| Channel ROAS disagrees with the platform’s | First, last and resolved models shown side by side with Revenue, Purchases, AOV and ROAS per channel | Attribution report Channels table |
Tell us what's broken. We'll fix your tracking — free.
Describe the tracking/attribution problem you're stuck on and we'll map it to a fix: server-side conversions to Meta, Google, TikTok and Pinterest, plus first-party tracking that survives Safari. No code required.
Sources
- https://developers.facebook.com/docs/marketing-api/conversions-api/parameters/custom-data
- https://developers.facebook.com/docs/marketing-api/conversions-api