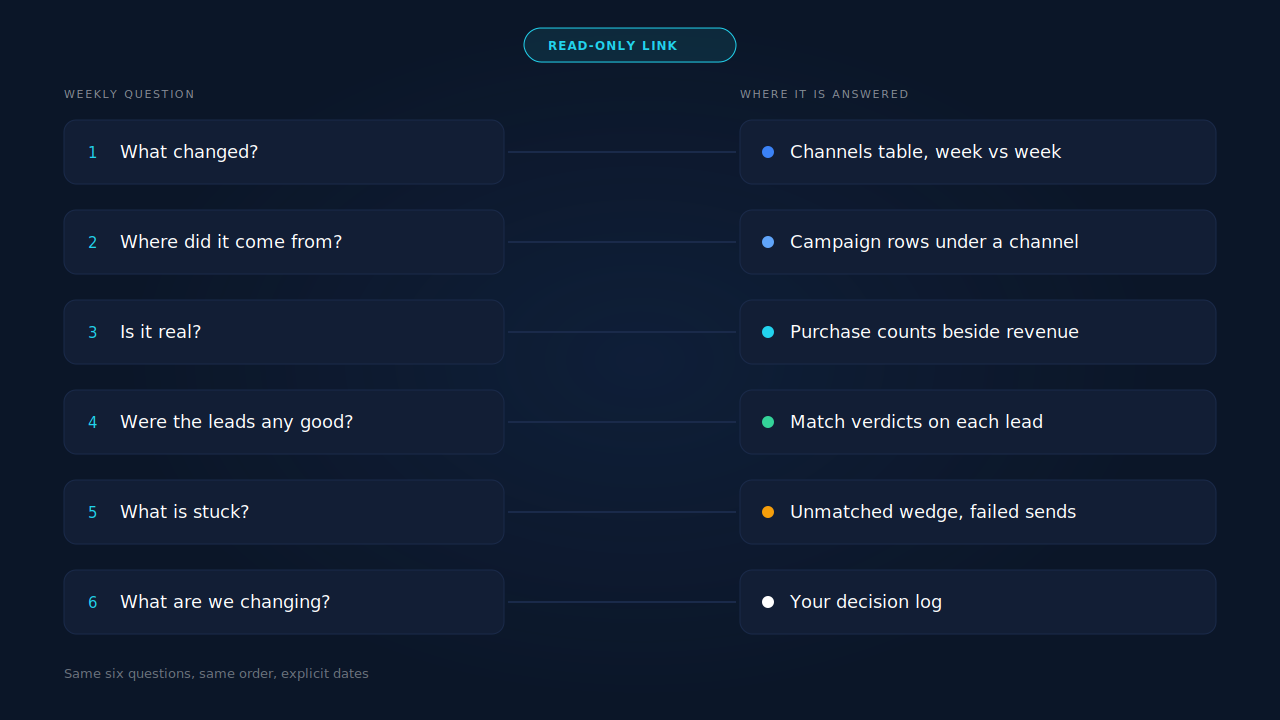
Ask the same six questions in the same order every week: what changed, where the change came from, whether there is enough data to act on it, whether the leads were any good, what is stuck, and what you are changing because of it. Explicit dates, a named attribution model, counts under every percentage.
The answers are not the point. The fixed wording is. When the question stays still week after week, a difference in the answer means the business moved. When you improvise a new question every Monday, you can never tell whether the number changed or the framing did.
What is a weekly attribution review supposed to produce?
Three decisions: what to scale, what to cut, and what to fix. Nothing else. A review that ends in a summary has failed, however well written the summary is — you spent an hour and changed nothing about where the money goes this week.
That constraint decides what belongs in the hour. A question earns its place only if some answer to it would change a budget, a form, a follow-up list or a piece of plumbing. “How did we do?” changes nothing. “Which campaign lost the most efficiency, and is that a real drop or four conversions?” changes something, or it explicitly doesn’t, and both are results.
It also sets the failure mode to watch for. An assistant reading your data will happily narrate a week — up here, down there, worth keeping an eye on that one — and narration is what most weekly reviews already produce without any AI involved. The job is not a better-written week. It is knowing which channel to scale by Tuesday morning.
Which six questions should you ask every Monday?
These six, in this order. Each one exists to set up the next, and each answer maps to a decision you can actually take.
- What changed? Last week versus the week before, same day count, same timezone, per source: visitors, leads, attributed revenue, purchases. No commentary yet — just the two columns and the delta.
- Where did the change come from? Push the biggest movers down a level: campaign, landing page, or both. A source-level number is an average of things that are doing different things.
- Is it real? Counts under every rate. A cost-per-lead that doubled on nine conversions is not a finding, and it reads exactly like one that doubled on nine hundred.
- Were the leads any good? Volume and quality move independently, and a week where both moved in opposite directions is the most common reason a “great week” produces no pipeline.
- What is stuck? Revenue that never got matched to a session, conversions that failed to dispatch, partial leads nobody called. This is the only question in the set that finds money rather than explaining it.
- So what are we changing? Name the budget shift, the paused ad set, the form field, or the follow-up list. If the answer is “nothing”, write that down too — it is a legitimate outcome once, and a warning sign twice in a row.
Six is not arbitrary — it is about as many as survive being asked properly in an hour. If you find yourself adding a seventh every week, it belongs on a dashboard, not in a chat.
How do you ask “what changed” without getting a story?
Specify the two windows, the metric with its denominator, the split, and the model — then ask for the table before the interpretation. Prose invites narrative; a table invites a decision. The same phrasing discipline that makes any assistant answer trustworthy is what makes a weekly delta comparable to last week’s.
For 1-7 September vs 25-31 August, in my account timezone,
list every traffic source with: visitors, leads, attributed
revenue and purchase count, under the last-touch model.
Show both weeks side by side and the absolute change.
Table only, no analysis yet.
Two details in there do most of the work. Same day count stops a five-day week from being compared with a seven-day one, which is the single most common way a weekly review invents a trend that does not exist. A named model stops the assistant from silently choosing one — first touch and last touch will credit the same purchase to different channels, and the gap between them is often larger than the week-on-week change you are trying to read. If you want the gap itself, ask for all the models at once; that is the honest way of reading an attribution report rather than picking the view that agrees with you.
Only after the table lands do you ask for interpretation, and even then ask it in a bounded form: “which three rows account for most of the change?” That question has a checkable answer. “Why did revenue drop?” does not — the assistant cannot see that you changed the offer on Thursday.
Which questions separate lead quality from lead volume?
The ones that name a population. “Leads” is at least three different numbers — people who typed an email and left, people who submitted, and people who passed a quality bar — and an assistant asked for “leads” returns one of them formatted as though it were the only one.
So ask for all three, split by source, every week:
- How many partial leads — contact details captured, form never submitted?
- How many completed submissions?
- How many scored as a strong match against our ideal customer, and how many as unlikely?
The interesting weeks are the ones where those three series disagree. Volume up and strong matches flat usually means a campaign found cheaper, worse traffic — the ad platform did exactly what you asked and you asked for the wrong thing. Volume flat and strong matches up is often a landing-page or offer change that nobody thought was an acquisition change.
One more, if sales sits close enough to answer: which sources produced leads that a human later agreed were worth calling? That is the only quality signal with a person behind it, and it beats every model, including the ones on your own dashboard.
What should you ask about the money that never got matched?
Ask what did not join. Every attribution stack has three leak buckets, and none of them show up in a revenue-by-source table: revenue with no session behind it, conversions that failed to reach the ad platform, and captured leads that nobody followed up.
Three questions cover it:
“How much revenue is unmatched, and is that share moving?” Unmatched revenue is orders that landed without an identity strong enough to tie them to a click. A stable share is a cost of doing business; a rising share is usually something breaking upstream — a checkout change, a new domain, a tag that stopped loading on one template. Worth knowing what a good match rate looks like before you panic at the number.
“Did any conversion sends fail this week?” Failed dispatches are silent by design. Nothing in the ad account says “you were supposed to get 40 more conversions”; the campaign just optimises worse.
“Which captured leads from last week were never contacted?” This is the one that pays for the meeting. A list of people who typed their email and phone, matched your ideal customer, and got no call is a same-day action, not an insight.
Which questions are a waste of a Monday?
Four kinds: forecasts, causes, rankings on tiny samples, and anything a saved report already answers identically every week.
Forecasts. “What will next month look like?” produces a confident number assembled from nothing. Your own seasonal read and your spend plan beat it.
Causes. An assistant can see that cost per lead doubled. It cannot see the creative you swapped, the competitor who entered the auction, or the public holiday. Causal claims stay yours; ask it for the shape of the change and supply the reason yourself.
Rankings on tiny samples. Ten sources ranked on four purchases is noise with an ordering, presented in exactly the same tone as a ranking built on thousands.
Standing numbers. If you check it every single week, it belongs on a screen. A saved report is reproducible and identical for everyone who opens it; a chat answer drifts with the phrasing. Read the standing numbers off the report, and spend the conversation on the digging behind them — the cross-report joins and one-off slices nobody built a filter for.
How do you keep this week’s answers comparable to last week’s?
Freeze the wording and keep it in a file. Four things have to stay constant: the phrasing, the window length, the timezone, and the attribution model. Change any one of them and this week’s number stops being comparable to last week’s — quietly, with no warning in the answer.
Practical version: keep the six prompts in a text file or a note, paste them in as a block, and change only the dates. It looks unglamorous next to a chat interface that invites improvisation, and that is the entire point.
Two habits on top. Paste last week’s numbers in with the question and ask the assistant to reconcile against them — disagreements surface immediately instead of a month later. Log the decision, not the report. Three lines in the same file every week (“shifted 20% of budget from A to B; paused C; fixed the phone field”) turns a review into a record you can audit next quarter, when someone asks why spend moved.
How does PartialLeads answer these questions each Monday?
PartialLeads exposes a read-only MCP endpoint, so an assistant like Claude or ChatGPT can query your own account — leads, traffic sources, pages and revenue — and every answer it gives maps to a screen you can open and check. You create a key under Settings → AI Access and point the assistant at it; the step-by-step is in connecting Claude and ChatGPT to your PartialLeads data.
Where each question lands:
- What changed, and where from. The Attribution report carries a period selector, a timezone selector and a currency selector, and every KPI shows a versus-prior comparison. Its Channels table breaks out revenue, purchases, AOV, average lag, visitors, visitor-to-lead rate and ROAS per channel, and paid channels expand to their campaigns — which is question 2 answered without a second screen.
- Is it real. Purchase counts sit beside every revenue figure, and the models disagree in public: first touch, last touch and PartialLeads Resolved are computed side by side, each with its own purchase count.
- Were the leads any good. Each lead is scored against your ideal-customer persona with a verdict and a confidence, and strong matches surface in a priority inbox above the lead table.
- What is stuck. The Purchases ledger separates matched from unmatched revenue, refunds are written as their own rows so they net against the total, and the Revenue by Match Quality split shows partial-captured versus submit-completed versus unmatched. The CAPI activity log shows what was sent and what failed.
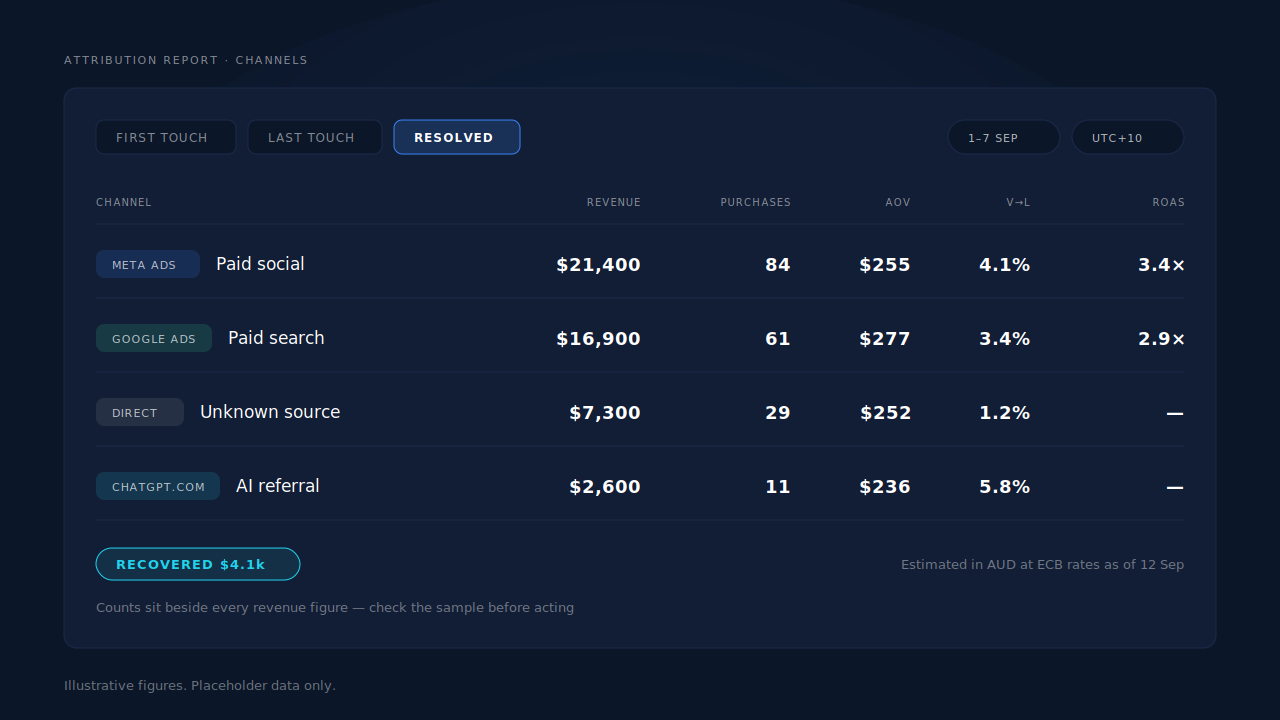
The honest constraints, because they decide how much weight a Monday answer can carry. The connection is read-only — the assistant reports, it never acts, and nothing it says changes a lead, a dispatch or a setting. Access is plan-gated rather than on by default. Ad spend originates in your ad account, so any cost-per-lead figure in the review is arithmetic you supply the numerator for. And every answer inherits the caveats of the data underneath it: the display model is last-non-direct over a 28-day decay window, multi-currency figures are estimates converted at a dated rate, and some conversion metrics can still read as warming up while they compute. An assistant will not volunteer any of that. The fixed question set is what makes you ask.
| What breaks | The mechanism | Where you see it in the dashboard |
|---|---|---|
| Monday starts with a different question every week | One read-only connection over leads, sources, pages and revenue, asked a fixed question set | Settings → AI Access |
| “Revenue moved” with no cause attached | First touch, last touch and PartialLeads Resolved computed side by side, recovered attribution itemised by mechanism | Attribution report, model comparison |
| A rate changes and the sample is four conversions | Purchase counts printed beside every revenue figure, campaigns expandable under each channel | Channels table |
| Volume looks fine but pipeline doesn’t | Two-step enrichment scores every lead against your ideal-customer persona | Customer Match card, priority inbox |
| Revenue lands with nothing tying it to a click | Purchase matching by visitor ID, email and phone, refunds netted as their own rows | Purchases ledger, matched/unmatched wedge |
| Last week’s answer can’t be compared with this week’s | Period, timezone and currency selected per report, conversion rate dated | Attribution report chips |