Divide each source’s spend by the number of leads from that source that match your ideal customer — not by its total lead count. Cost per lead ranks sources by volume. Cost per qualified lead ranks them by fit. The two rankings routinely disagree, and the cheap source at the top of the first list is often the expensive one on the second.
The switch costs nothing in ad spend and changes which campaigns you cut. It needs two things: a definition of “qualified” you apply to every lead the same way, and a source on every lead — including the ones who typed their email and never submitted.
Why does cost per lead rank your sources wrong?
Because it treats every lead as interchangeable. Cost per lead (CPL) measures how cheaply a source produces form fills, and nothing about whether those form fills can buy from you. A source delivering students, competitors and people in countries you do not ship to will beat a source delivering buyers, because a form fill is cheaper to produce than a fit.
That would be a reporting annoyance if the number stayed in a report. It does not. CPL is what gets read out in the weekly meeting, and usually what the ad platform is optimising toward, because the conversion event you send back is “lead” with no quality attached. The damage lands in three places.
Budget moves the wrong way. The lowest-CPL source gets the increase, and if its leads do not convert you have bought more of your worst traffic. The effect shows up in pipeline six weeks later, when nobody remembers the budget change.
Sales capacity goes to the wrong calls. A rep’s day is the real constraint in most lead-gen businesses. Two hundred cheap leads that cannot buy cost more than forty expensive ones that can.
The optimiser learns the wrong pattern. Platforms build targeting from the conversions you report. Report every lead equally and the algorithm gets very good at finding people who fill in forms — a real behavioural segment, and not the one you want.
CPL is not a bad metric. It is an accurate measurement of the wrong thing: how cheaply a source can make somebody type their email, which is a question about your form, not about your market.
What makes a lead “qualified”?
Fit against a written definition of your ideal customer, decided before you look at any cost numbers. Qualified means the company and the person could plausibly buy: the right industry, the right size, the right role, a country you sell into, and none of your disqualifiers. It does not mean the lead was enthusiastic, and it does not mean a rep liked them.
The distinction that ruins most attempts at this metric is fit versus interest. A tyre-kicker who opens every email and books a call is interested and unqualified. A buyer who read one page and filled in a form is qualified and quiet. Build your rule from behaviour — email opens, page views, session length — and you will rank sources by how enthusiastic their traffic is, which is a different metric with the same shape. Writing a definition precise enough to test against is its own subject: start by learning how to score leads against your ideal customer before putting a cost figure next to it.
Two rules keep the denominator honest. Apply the definition identically across sources — hand-qualification drifts week to week and between people, and the comparison quietly becomes a comparison of who did the qualifying. And do not use “a rep called them” as your definition: contact rates depend on staffing, time zones and which leads the CRM surfaced first, which bakes your own operations into your media report.
The output worth keeping per lead is a verdict, a confidence level and the reasons behind it. A bare score gets argued with; a verdict with reasons can be checked — and it needs checking, because you are about to move budget with it.
How do you calculate cost per qualified lead?
Cost per qualified lead (CPQL) is source spend divided by the qualified leads attributed to that source, over the same window, under the same attribution rule. Every part of that sentence matters: change the window on one side, or the attribution rule between sources, and the comparison stops meaning anything.
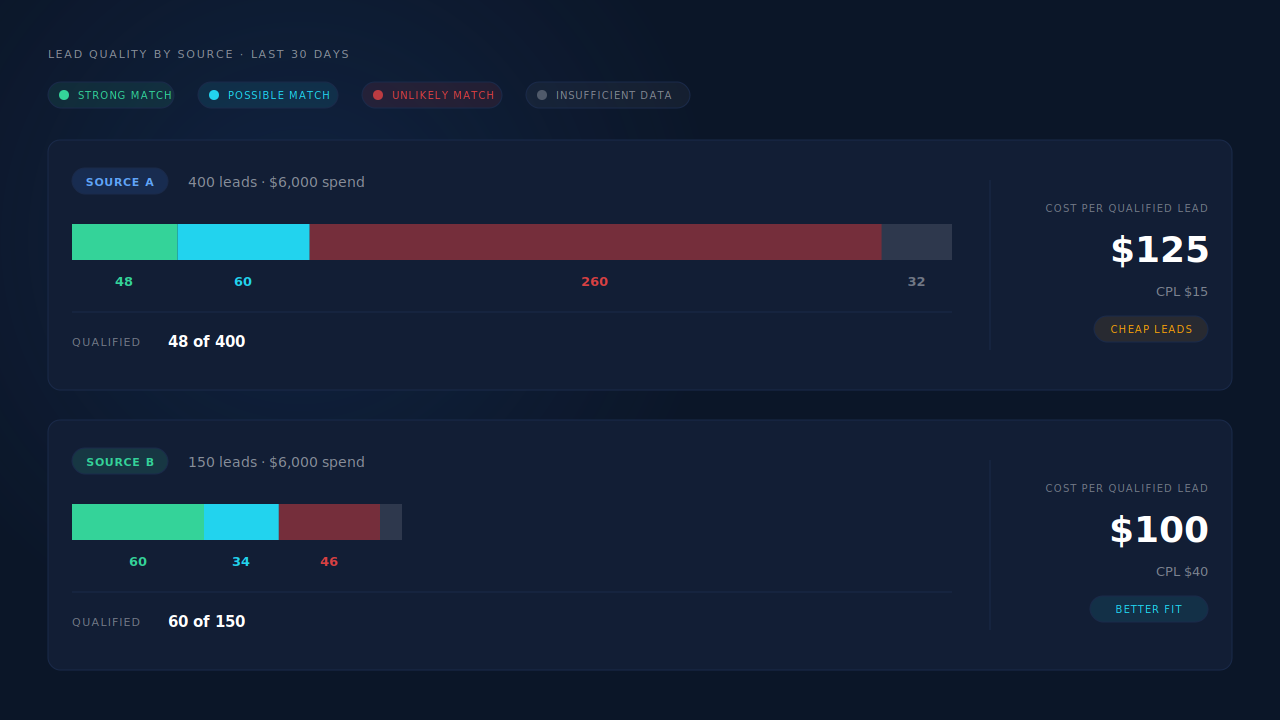
Work an illustrative example. Two sources, one month, the same qualification rule applied to both:
| Source | Spend | Leads | CPL | Qualified | CPQL |
|---|---|---|---|---|---|
| Source A | $6,000 | 400 | $15 | 48 | $125 |
| Source B | $6,000 | 150 | $40 | 60 | $100 |
On CPL, Source A wins by a distance and B looks like the campaign to cut. On CPQL the ranking inverts: B produces a usable lead for $100 while A charges $125 for the same thing. Those numbers are illustrative, but the shape is the normal result, not a contrived one — broad, cheap traffic buys volume at the cost of fit.
Three alignment problems break this calculation in practice.
The two windows must match. Spend lands on the day it was spent; a lead qualifies a day or two later, when enrichment runs. Divide this month’s spend by leads qualified this month and the last few days are under-counted, so any source with a slow qualification path looks worse than it is. Cut both sides at the same boundary, and hold the window open long enough for qualification to finish.
The attribution rule must be the same for all sources. Counting one source on last touch and another on first — what happens whenever some numbers come from the ad platform and others from your own reporting — makes the denominators incomparable. Pick one model and read every source through it. Model disagreement is useful information, but it belongs in how to read an attribution report honestly, not inside one ratio.
Unsourced leads need their own row. Dropping them silently flatters every source; spreading them evenly flatters the bad ones. Show the size of the unknown, and if it is large, fix attribution before trusting the ranking — leads that show up as Direct when they came from an ad are the usual cause.
How many leads do you need before the number means anything?
Enough that one or two verdicts cannot flip the ranking. A source with 12 leads and 3 qualified has a CPQL built on three data points; one lead moving from possible to strong changes it by a third. A practical test: recompute the ranking with each source’s single best-fitting lead removed. If the order changes, you have noise with a dollar sign in front of it. While counts are small, use a rolling window rather than calendar months, so the denominator grows instead of resetting.
Why do partial leads belong in the count?
Because the leads your form lost were bought with the same money as the ones it kept. A visitor who typed an email and a phone number and then closed the tab is a partial lead: the spend happened, the intent happened, and the only thing missing is the click on submit. Count submissions only and every source is judged on how well it survives your form, not on the market it reached.
Form survival is not evenly distributed. Mobile-heavy social traffic abandons at a different rate than search traffic arriving with a specific intent, so ranking on completed submissions is partly ranking devices and partly ranking your own form length.
The qualified share of abandoners is a measurement in its own right. A source whose abandoners are strong fits has a form problem you can fix; one whose abandoners are as unqualified as its submitters has a targeting problem no shorter form will solve. Neither is visible if a lead only exists after submit — the practical argument for partial lead capture sitting underneath any lead-quality reporting.
Which decisions actually change when you rank by cost per qualified lead?
Four, and they are the ones that cost money.
Which campaign gets the increase. You scale from the fit ranking rather than the volume ranking. That is the whole point, and usually the only change anybody acts on in the first month.
Which campaign gets diagnosed instead of cut. A source with a high CPL and a high qualified share is an expensive source buying good people. The fix is creative, bid or landing-page work, not a pause — CPL alone would have cut it.
What you send back to the ad platform. Report every lead as a conversion and the optimiser learns to find form-fillers; report qualified leads and it learns to find people like your customers. Highest leverage, slowest to act, and it raises the stakes on your definition — give the platform the wrong idea of “good” and it will pursue that idea diligently.
When to stop comparing sources at all. If every source lands at roughly the same CPQL, the next win is at campaign, audience or creative grain — the same move as deciding which channel to scale when the channel numbers refuse to separate.
What can go wrong with cost per qualified lead?
Three failure modes, and knowing them keeps the metric from being trusted too hard.
Qualification is a judgement, not a measurement. A verdict about fit is an opinion formed from evidence, and it can be wrong in both directions — tolerable at source grain, where evenly distributed errors leave the ranking intact, and costly at lead grain, where somebody gets ignored.
The definition drifts. Change your persona mid-quarter and the trend breaks, because the denominator changed meaning. Re-score history, or treat it as two separate series.
It says nothing about revenue. A qualified lead is a lead worth working, not a sale. Two sources with identical CPQL can produce very different close rates and order values. CPQL is the right ranking for spending sales time; revenue per source is still the ranking for spending money.
How does PartialLeads help you compare sources by cost per qualified lead?
By producing the denominator: a verdict on every lead, applied identically, with a source attached — including for the leads that never submitted.
The capture layer records the source as the visitor types, not at submit. The tag stores UTMs, the referrer when there are no UTMs, and the click IDs each platform uses (gclid, gbraid, wbraid, fbclid, msclkid, ttclid, epik) on the session; field capture on input with a terminal flush before the page goes away means an abandoned form still leaves an email, a phone number and an origin. Sessions are stitched into one person through a six-tier identity cluster — visitor ID, email, phone, IP plus user agent, device fingerprint and click ID — so somebody who arrived from an ad on Monday and returned directly on Thursday is one lead attributed to the ad, not two leads attributed to two different things.
Qualification then runs per lead in two steps: a search-backed enrichment pass researches the email domain and the person, and a scoring pass evaluates that evidence against your written ideal-customer persona. The output is a verdict — strong match, possible match, unlikely match, or insufficient data — with a confidence score and its reasons, shown as a Customer Match card on the lead, with strong matches surfacing in a priority inbox above the lead table. Results are cached per email and persona version.
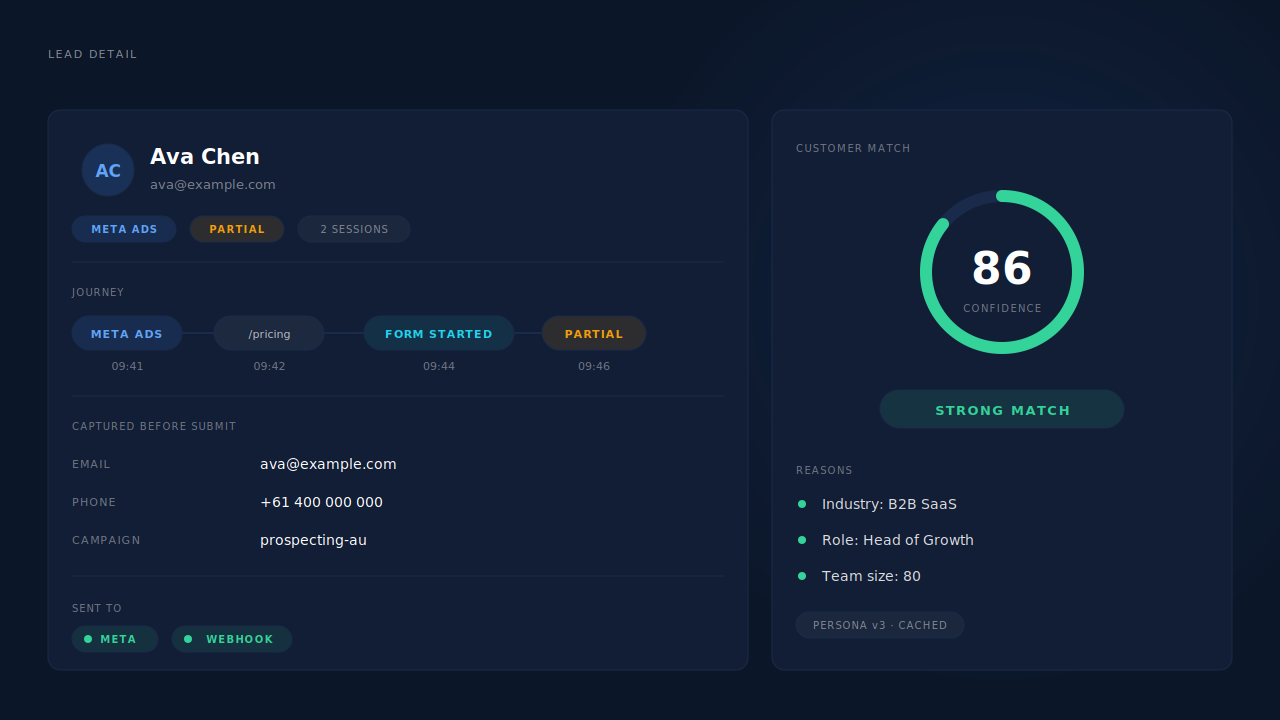
You read the result on two surfaces. The Leads list carries each lead’s source, its journey as a row of touch badges, and a Partial or Completed status, so qualified leads and abandoned ones are both visible with their origin. The Attribution report’s channels table carries visitors, visitor-to-lead rate, revenue, purchases, average lag and ROAS per channel, with paid channels expanding to their campaigns — that is where the downstream half of the question, whether those qualified leads actually buy, gets answered.
Two honest constraints. There is no cost-per-qualified-lead column: the spend figure comes from your ad platform, and the ratio is arithmetic you do with the qualified counts and sources the product gives you. And the rules that decide which leads get sent back to Meta or Microsoft as conversions are rule-based conditions you configure — field and pattern matches, with a preview of how many of the last seven days’ leads a rule would have matched — not the AI verdict. The verdict is a surface you rank with; the send gate is the rule set. Today they are two separate decisions.
| What breaks | The mechanism | Where you see it in the dashboard |
|---|---|---|
| Cheap source wins on CPL, produces nobody worth calling | Two-step AI enrichment and scoring against your ideal-customer persona, per lead | Customer Match card with confidence and reasons; strong matches in the priority inbox |
| Leads that abandoned the form never enter the comparison | Field capture on input with a terminal flush before pagehide, so email and phone survive a closed tab |
Leads list, Partial status badge with the lead’s source |
| The source is missing or wrong on the lead | UTM and click-ID capture with referrer fallback, stored per session at first touch | Leads list source badge and UTM column |
| One person counted as several leads across several sources | Six-tier identity cluster stitching sessions into one person | Journey ribbon on the Leads list row |
| Qualified leads that never turn into revenue | Purchases matched to sessions with first-touch and last-touch rows written per purchase | Attribution report channels table: revenue, purchases, avg lag, ROAS |
Tell us what's broken. We'll fix your tracking — free.
Describe the tracking/attribution problem you're stuck on and we'll map it to a fix: server-side conversions to Meta, Google, TikTok and Pinterest, plus first-party tracking that survives Safari. No code required.
Sources
https://developers.facebook.com/docs/marketing-api/conversions-api/ https://developers.facebook.com/docs/marketing-api/conversions-api/parameters/customer-information-parameters