Track Wistia video engagement per page by aggregating Wistia’s play-event stream — each play reports the exact URL it happened on — and joining those page-level stats to each page’s visitor and conversion numbers. Per page, per video, you get plays, unique viewers, average percent watched, total watch time, and a completion funnel (how many plays reached 25 / 50 / 75 / 90%). That join answers the question neither your video host nor your funnel analytics answers alone: on which pages does the video actually get watched — and do the watchers convert?
If your funnel leans on video — a VSL, a demo walkthrough, a webinar replay, an explainer above the form — the video is usually the most expensive asset on the page and the least measured one in context. This article covers why the video-to-page join is missing everywhere, what flying blind costs, and how PartialLeads ships the join as part of its Pages report.
Why can’t you see video engagement per page?
Three structural reasons, and they compound:
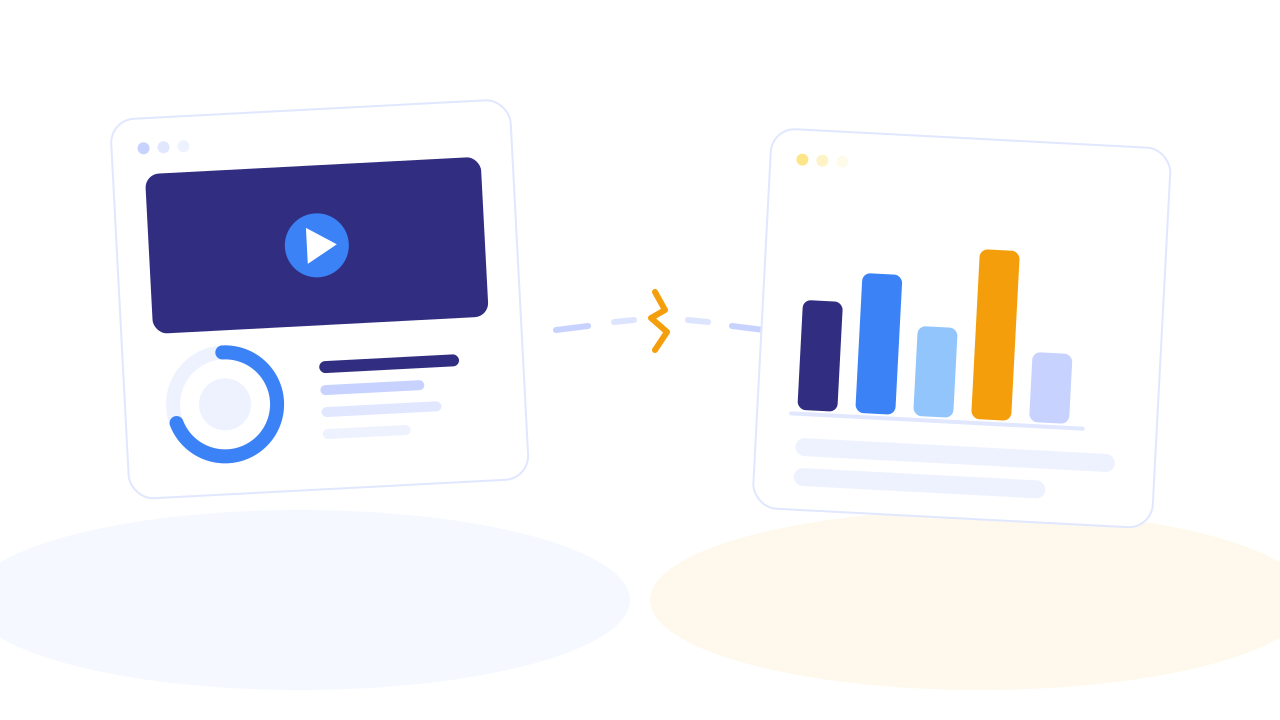
1. Your video host reports by video; your analytics report by page. Wistia’s dashboard tells you a video averaged 43% engagement — across every place it’s embedded. Your funnel analytics tell you the /offer page converted at 3.1% — with no idea whether anyone pressed play. The same video embedded on your homepage, a landing page, and a popover gets one blended number; the pages get none. The two datasets describe the same visitor moment and never meet.
2. Embed-location data is unreliable at the source. Video platforms nominally track “where is this video embedded” — but in practice that data is empty or partial for many real accounts, especially older embeds, funnel-builder embeds, and popover players. If your per-page video report depends on the platform’s embed registry, it reports nothing exactly where your funnel lives. The reliable source is the play events themselves: every play carries the URL it happened on. Page-level truth has to be aggregated from plays, not looked up from a registry.
3. Multi-video pages blend into mush. A long-form sales page with a VSL at the top and three testimonial clips below reports — where it reports anything — as “video activity on this page.” Which video did the work? Did anyone reach the pricing reveal at the 70% mark of the VSL, or did they only watch the 30-second testimonials? Without per-video, per-page separation, you can’t tell the asset that sells from the garnish.
What does the missing join cost?
For video-led funnels, three expensive blind spots:
You optimize the page around an unmeasured centerpiece. Teams A/B test headlines, button colors, and form length while the VSL — the element doing the persuasion — ships with zero page-level measurement. If 80% of visitors never press play, the winning move is the thumbnail or placement, not the headline. If plays are high but drop at 25%, the problem is the first two minutes of the video. Without per-page video data, every one of those diagnoses is a guess.
You can’t compare placements. The same demo video lives on three landing pages. Which placement earns real watch time? Where do viewers bail? Blended video-level stats can’t say; page-level stats with no video data can’t either. Media spend gets allocated across pages with no idea which page makes the video work.
Watch-through and conversion stay uncorrelated. The question that actually matters — do people who watch past 75% convert more? — needs video engagement and conversion on the same page-level row. When a page’s completion funnel and its lead count finally sit side by side, patterns surface fast: pages where deep watchers convert (make the video more prominent), and pages where conversions happen without plays (the video is furniture — move or cut it).
How does PartialLeads put video engagement on every page?
Connect Wistia once (an API token — no code changes, no re-embedding), and the join builds itself:
Embeds are discovered from actual plays. PartialLeads syncs Wistia’s raw play-event stream, and every play event carries the URL it happened on. That means the system learns where each video is embedded from reality — including old embeds, funnel-builder pages, and popover players that embed registries miss. If a video plays somewhere, that page shows up. First connect backfills 90 days of history, so the report is useful on day one, and the sync keeps rolling forward automatically — including late-arriving events.
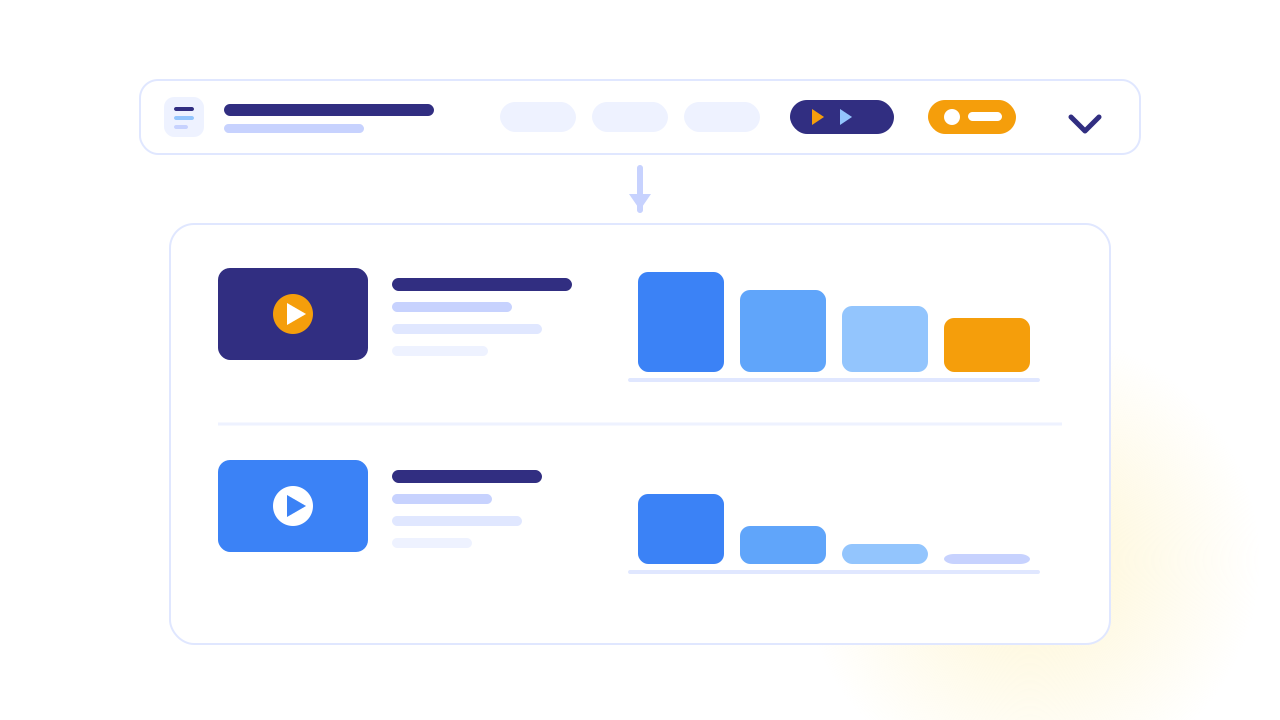
Every page row gains video columns. The Pages report — the same one showing each page’s visitors, leads, and conversions — gains plays, unique viewers, engagement, and watch time per page. Video performance and page performance finally read on one line, with days bucketed in your timezone so plays divide cleanly by that day’s pageviews.
Drill into a page, see every video on it. The page drill lists each video embedded there — thumbnail, name, plays, average percent watched, total watch time — and the completion funnel: the share of plays that reached at least 25%, 50%, 75%, and 90%. A page with a VSL and three testimonial clips shows four rows, each with its own funnel. The asset that sells and the garnish stop sharing a number.
Multiple embeds aren’t just handled — they’re the point. The per-page video count surfaces right in the report, so video-heavy pages are visible at a glance, and every embedded video is measured separately on every page it appears on. The same VSL on three pages produces three independent report lines — placement comparison built in.
Honest boundaries: this is a Wistia integration — YouTube and Vimeo embeds aren’t covered. The data is per-page, per-video aggregate — plays, unique viewers, watch time, completion shares, and daily trend — not a per-named-lead watch timeline; you see that 38 people reached 75% on this page, not which lead did. And it measures plays: a page whose video is never started shows honest zeros, which is itself the diagnosis.
The missing join, closed in one view:
| The gap today | PartialLeads mechanism | Where you see it working |
|---|---|---|
| Video stats by video, page stats by page — never joined | Play-event aggregation matched to pages by URL, overlaid on the Pages report | Plays, viewers, watch time beside each page’s leads and conversions |
| Embed-location data empty for real-world embeds | Embed discovery from actual play events | Funnel-builder and popover embeds appearing with full stats |
| Multi-video pages blend into one number | Per-video separation on every page | Page drill: each video with its own thumbnail, stats, and funnel |
| No idea how far viewers get | Completion funnel per video per page | ≥25 / ≥50 / ≥75 / ≥90% columns |
| Placement performance unknowable | Same video measured independently per page | Three pages, three report lines for one VSL |
| New tool = empty report for months | 90-day backfill on first connect | A populated report the day you connect |
Setup is the Wistia API token plus the tag you already run — minutes. The free tier (50 leads) includes the Pages report, so you can see your video-to-conversion join before paying anything.
Recover the leads you're already earning
Tell us what you're trying to track or fix. We'll show you which visitors your forms miss — and how PartialLeads recovers and qualifies them.
Sources
- Wistia Docs — Stats API (events): https://docs.wistia.com/docs/stats-api
- Wistia Docs — Getting started with the Data API: https://docs.wistia.com/reference/getting-started-with-the-data-api
- Nielsen Norman Group — Video usability research: https://www.nngroup.com/articles/video-usability/