Most “form abandonment cost” articles overstate the recoverable number by treating every abandonment as a missed sale. They aren’t. The real math is more useful: a modest, defensible recovery rate applied to the actual conversion economics of your business.
How do you calculate the cost of form abandonment?
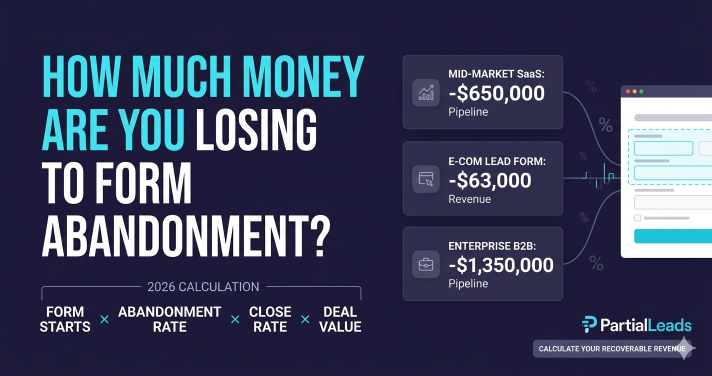
The base formula is four numbers multiplied together. Each one is something you already track or can pull in 15 minutes.
| Input | What it is | Where to find it |
|---|---|---|
| Form starts (monthly) | Unique visitors who interacted with at least one form field | GA4 event, Hotjar, Zuko, or form_start analytics event |
| Abandonment rate | 1 minus (form completions ÷ form starts) | Our tracking/attribution tool can do this - PartialLeads |
| Close rate | Completed forms that become paying customers | CRM dashboard or sales-ops reporting |
| Average deal value | Total revenue per closed deal | CRM dashboard or finance reporting |
The headline cost is the total pipeline value lost:
total_pipeline_value_lost = form_starts × abandonment_rate × close_rate × average_deal_value
The recoverable cost — the portion you could realistically capture back — applies a recovery rate to that total:
recoverable_cost = total_pipeline_value_lost × recovery_rate
Where recovery_rate is what percentage of abandoned forms you can convert back into completed leads. Vendor case studies cite 10–30% recovery rates (Insiteful, 2024); a conservative planning assumption for new programs is 5–15%.
The total pipeline value lost is dramatic. The recoverable cost is what you can actually act on. Lead with the recoverable number when you build the business case, and use the total as the ceiling.
What does form-abandonment cost look like in practice?
Three worked examples covering different business shapes. The math is the same — only the inputs change.
Example 1: Mid-market SaaS demo-request
A B2B SaaS company runs a demo-request form. The form has 7 fields. Their stack is HubSpot for CRM, Google Ads + Meta Ads for paid acquisition.
| Input | Value |
|---|---|
| Form starts per month | 1,000 |
| Abandonment rate | 65% |
| Close rate (form → customer) | 20% |
| Average deal value (ACV) | $5,000 |
Math:
| Calculation | Value |
|---|---|
| Abandoned forms | 1,000 × 0.65 = 650 |
| Total pipeline value lost (ceiling) | 650 × 0.20 × $5,000 = $650,000 / month |
| Recoverable at 5% recovery rate (conservative) | $650,000 × 0.05 = $32,500 / month |
| Recoverable at 10% recovery rate (typical) | $650,000 × 0.10 = $65,000 / month |
| Recoverable at 20% recovery rate (high-performing) | $650,000 × 0.20 = $130,000 / month |
The headline pipeline number is $650k/month. The number worth building the business case on is the $65,000/month at a typical 10% recovery rate. That’s $780,000 annually from one form, with no additional ad spend.
Example 2: E-commerce lead form (pre-purchase email capture)
A direct-to-consumer brand runs a “get 10% off” email-capture form on the product pages. The capture funnel feeds an email sequence that drives the first purchase.
| Input | Value |
|---|---|
| Form starts per month | 10,000 |
| Abandonment rate | 70% (Baymard cart-abandonment proxy, 2026) |
| Close rate (capture → first purchase) | 12% |
| Average first-order value | $75 |
Math:
| Calculation | Value |
|---|---|
| Abandoned forms | 10,000 × 0.70 = 7,000 |
| Total revenue lost (ceiling) | 7,000 × 0.12 × $75 = $63,000 / month |
| Recoverable at 10% recovery rate | $63,000 × 0.10 = $6,300 / month |
| Recoverable at 15% recovery rate | $63,000 × 0.15 = $9,450 / month |
E-commerce numbers are smaller in absolute dollars per recovered lead but compound on lifetime value — a recovered first purchaser converts to a repeat customer at the same rate as a baseline acquired customer, so the annualized customer lifetime value multiplier kicks in.
Example 3: B2B enterprise sales (high-touch demo + sales cycle)
An enterprise SaaS company runs a long demo-request form with 12 fields (firmographic, budget, timeline questions). Average sales cycle is 90 days.
| Input | Value |
|---|---|
| Form starts per month | 200 |
| Abandonment rate | 75% (long forms cluster at 70%+) |
| Close rate (demo → customer) | 18% |
| Average contract value (ACV) | $50,000 |
Math:
| Calculation | Value |
|---|---|
| Abandoned forms | 200 × 0.75 = 150 |
| Total pipeline value lost (ceiling) | 150 × 0.18 × $50,000 = $1,350,000 / month |
| Recoverable at 5% recovery rate (B2B is slower; conservative is right) | $1,350,000 × 0.05 = $67,500 / month |
Even at conservative recovery, this is $810,000 in annualized recovered ACV from one form. The argument for partial-lead capture in B2B is structural: per-lead value is so high that even a 5% recovery rate produces six-figure annual pipeline lift.
Why “cost of abandonment” isn’t the same as “recoverable revenue”
Most form-abandonment-cost articles report the ceiling number and stop there. The reader walks away thinking they’re losing the full pipeline value to abandonment. They aren’t — and the overstated number erodes credibility when the recovery program ships and delivers a fraction of it.
The honest framing has three layers:
- Total pipeline value lost — the ceiling. Useful for budget-justification conversations because it’s the largest defensible number. Should never be promised as a recovery target.
- Recoverable cost — what a partial-lead capture and recovery program can realistically convert back. This is the number to commit to. Range: 5–15% of the ceiling for new programs, climbing to 20–30% for well-optimized ones.
- Net realized lift — what actually shows up in next quarter’s revenue after the recovery program is deployed. Equals recoverable cost minus the time-to-first-recovered-conversion delay, minus the share of recovered leads that would have converted via other channels anyway. The third layer is the one that gets debated in finance meetings. A safe planning number is 70–80% of recoverable cost — accounting for some cannibalization of organic re-engagement that would have happened without the recovery sequence.
If your business case promises the ceiling, you’ll miss it by 5–10x. If it promises the recoverable cost, you’ll come close. If it promises the net realized lift, you’ll usually beat it.
What can you realistically recover?
The recovery-rate range that shows up across vendor case studies and operator-reported data:
| Recovery configuration | Typical recovery rate |
|---|---|
| No recovery at all (forms just abandoned) | 0% |
| Manual sales-team follow-up on partials (B2B only) | 8–20% |
| Single recovery email within 24 hours | 8–15% |
| Two-touch recovery sequence (1 hour + 24 hours) | 12–20% |
| Two-touch sequence + SMS for B2C | 15–25% |
| High-optimization vendor case studies (Insiteful, MightyForms, Formstack) | 20–30% |
The two largest variables are what data you captured before abandonment (email + name + phone recovers at 2–3x the rate of email alone) and how fast the first recovery touch fires (MagicTag, 2024 reports a 20.3% conversion rate at the 1-hour mark vs 12.2% at 24 hours — almost 2x decay).
The implication for your math: if your partial-capture setup gets email only and your recovery email fires the next day, plan for the bottom of the range (5–10%). If you capture email + name + phone and fire within the hour, plan for the middle of the range (15–20%). The high end (25–30%) is reserved for accounts that have optimized the full sequence across several months of testing.
How does PartialLeads change the recovery math?
Two compound effects, beyond the direct recovery rate:
1. Server-side CAPI lifts ad efficiency on top of direct recovery.
When PartialLeads sends a recovered partial lead as a Meta Conversions API event, Meta’s algorithm sees the conversion and bids more aggressively for similar users in the next campaign cycle. The result is a meaningful drop in cost per result for ongoing ad spend — Meta has publicly stated that advertisers running CAPI alongside the Pixel see lower CPL than Pixel-only setups. For a SaaS business spending $50k/mo on Meta Ads, even a 10% efficiency lift is $5,000/mo of recovered ad budget independent of the direct recovery dollars.
2. Capture before submit expands the recovery pool beyond completed-submit-only setups.
A traditional CAPI setup only fires events on form submit. Abandoned forms produce zero CAPI events, which means Meta’s algorithm never sees them and never trains on the audience characteristics that drove them. PartialLeads’ capture-on-input pattern fires a CAPI event for partial leads — abandoned forms with email captured become signals Meta can optimize against. The pool of training events grows, and ad performance improves across the account, not just for the recovered leads themselves.
The compound math for the Example 1 SaaS case ($1,000 form starts/mo, $5,000 ACV, $50k/mo ad spend):
| Source of lift | Monthly value |
|---|---|
| Direct recovery (10% of $650k pipeline) | $65,000 |
| Ad-efficiency lift on $50k spend (estimated 10%) | $5,000 |
| Expanded CAPI training pool (estimated 5% incremental ROAS lift on the same spend) | ~$2,500 |
| Total compound monthly lift | ~$72,500 |
The compound math turns a $65k direct-recovery story into a $72k+ story without changing the headline recovery number. Most CFOs care about the compound; most marketing leads care about the direct. PartialLeads’ positioning should land both.
How to run this calculation for your own business
Plug your numbers into the worksheet below. Inputs in the left column come from your CRM and analytics; outputs in the right column compound to the total. The whole exercise takes 15 minutes.
| Field | Your value |
|---|---|
| Form starts per month | _____ |
| Abandonment rate (decimal — e.g., 0.65) | _____ |
| Close rate from form (decimal — e.g., 0.20) | _____ |
| Average deal value ($) | _____ |
| Abandoned forms (= starts × abandonment rate) | _____ |
| Total pipeline value lost (= abandoned × close × deal value) | $_____ |
| Recoverable at 5% (conservative) | $_____ |
| Recoverable at 10% (typical) | $_____ |
| Recoverable at 20% (high-performing) | $_____ |
Three rules for using the result:
- Lead with the typical (10%) number in the business case. Ceiling numbers are for context, not commitments.
- Bracket the recovery rate against your actual capture quality. Email-only captures should use the conservative range; email + name + phone with sub-hour recovery should use the higher range.
- Compound the direct recovery with the ad-efficiency lift if you’re running paid acquisition. The two effects add cleanly; pretending only one exists understates the case. The point of the calculation isn’t to produce an inflated headline. It’s to make the cost real enough that the recovery program competes with other engineering and marketing investments on equal footing.
Sources
- DigitalApplied — Form Conversion Rate Benchmarks 2026: https://www.digitalapplied.com/blog/form-conversion-rate-benchmarks-2026-data-points
- Baymard Institute — Cart Abandonment Rate Statistics 2026: https://baymard.com/lists/cart-abandonment-rate
- Insiteful — Recover Abandoned Form Leads: https://insiteful.co/blog/recover-abandoned-form-leads/
- MagicTag — 7 Ways to Recover Abandoned Form Leads: https://www.magictag.ai/blog/recover-abandoned-form-leads-methods/
- Meta Business Help — About the Conversions API: https://www.facebook.com/business/help/353532912433684
- Feathery — 150 Online Form Statistics: https://www.feathery.io/blog/online-form-statistics